
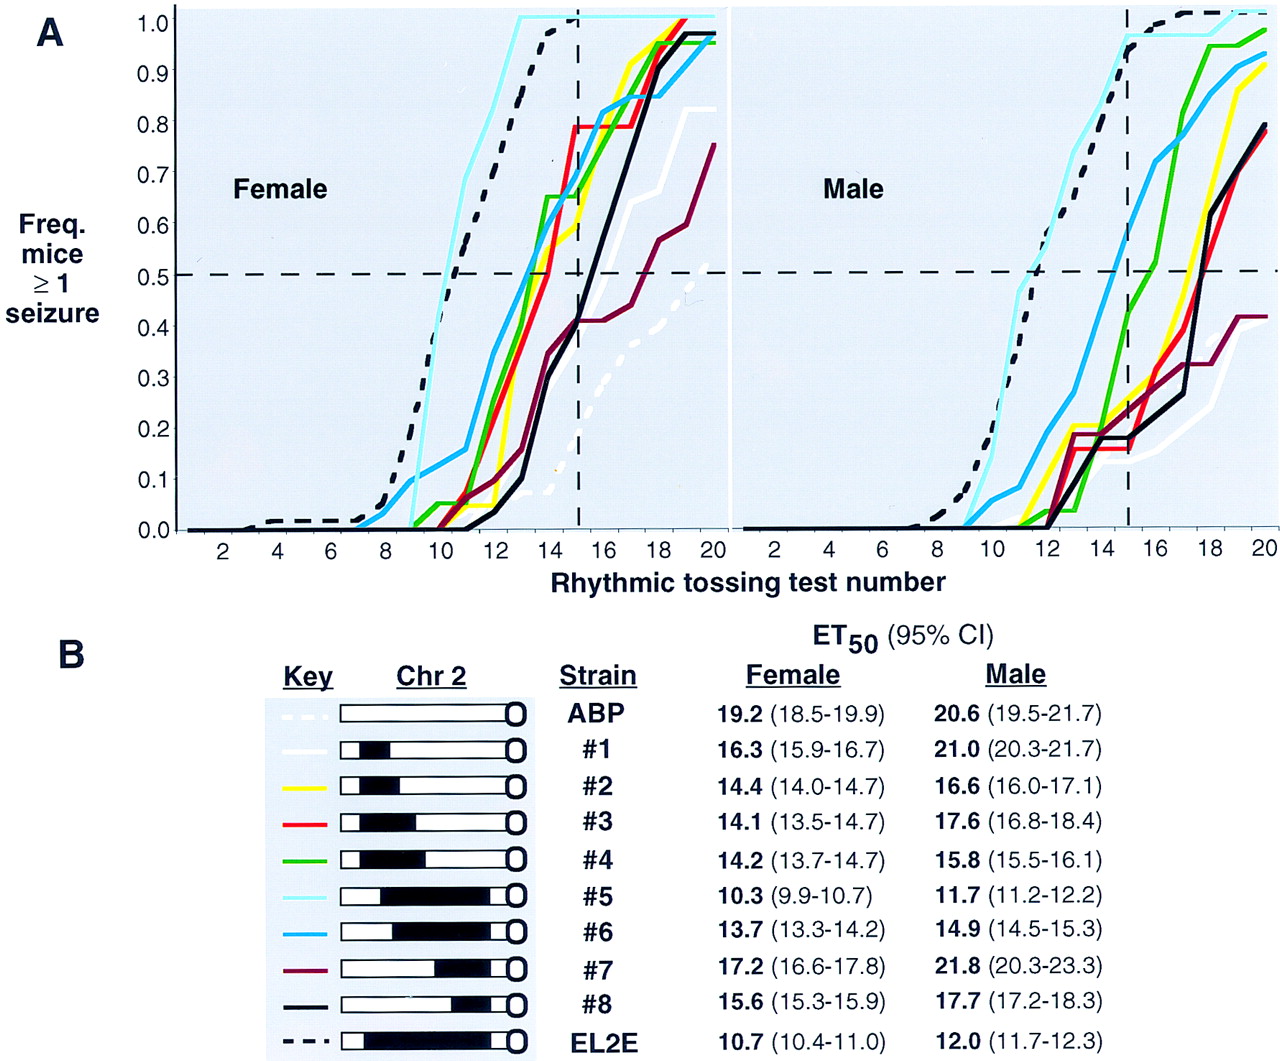
Cumulative onset for rhythmic tossing-induced seizures. (A) The frequency of the number of seizures in females or males per strain is plotted for each rhythmic tossing test and points connected by colored lines (key is shown in B). Thin broken horizontal lines within the plot highlight the 50% mark and the fifteenth seizure test, respectively, chosen for subsequent analysis as described in the text. (B) Graphic representation of the EL-like interval (in black; actual values are detailed in Table 1) retained in each of the congenic and recombinant strains, on its ABP background (white), with the Chromosome 2 centromere depicted as a ball and the colored lines used for each in A. The text table gives the effective number of tests for 50% (ET50) of each strain to have experienced at least one seizure, as determined by Probit analysis described in the text.


