
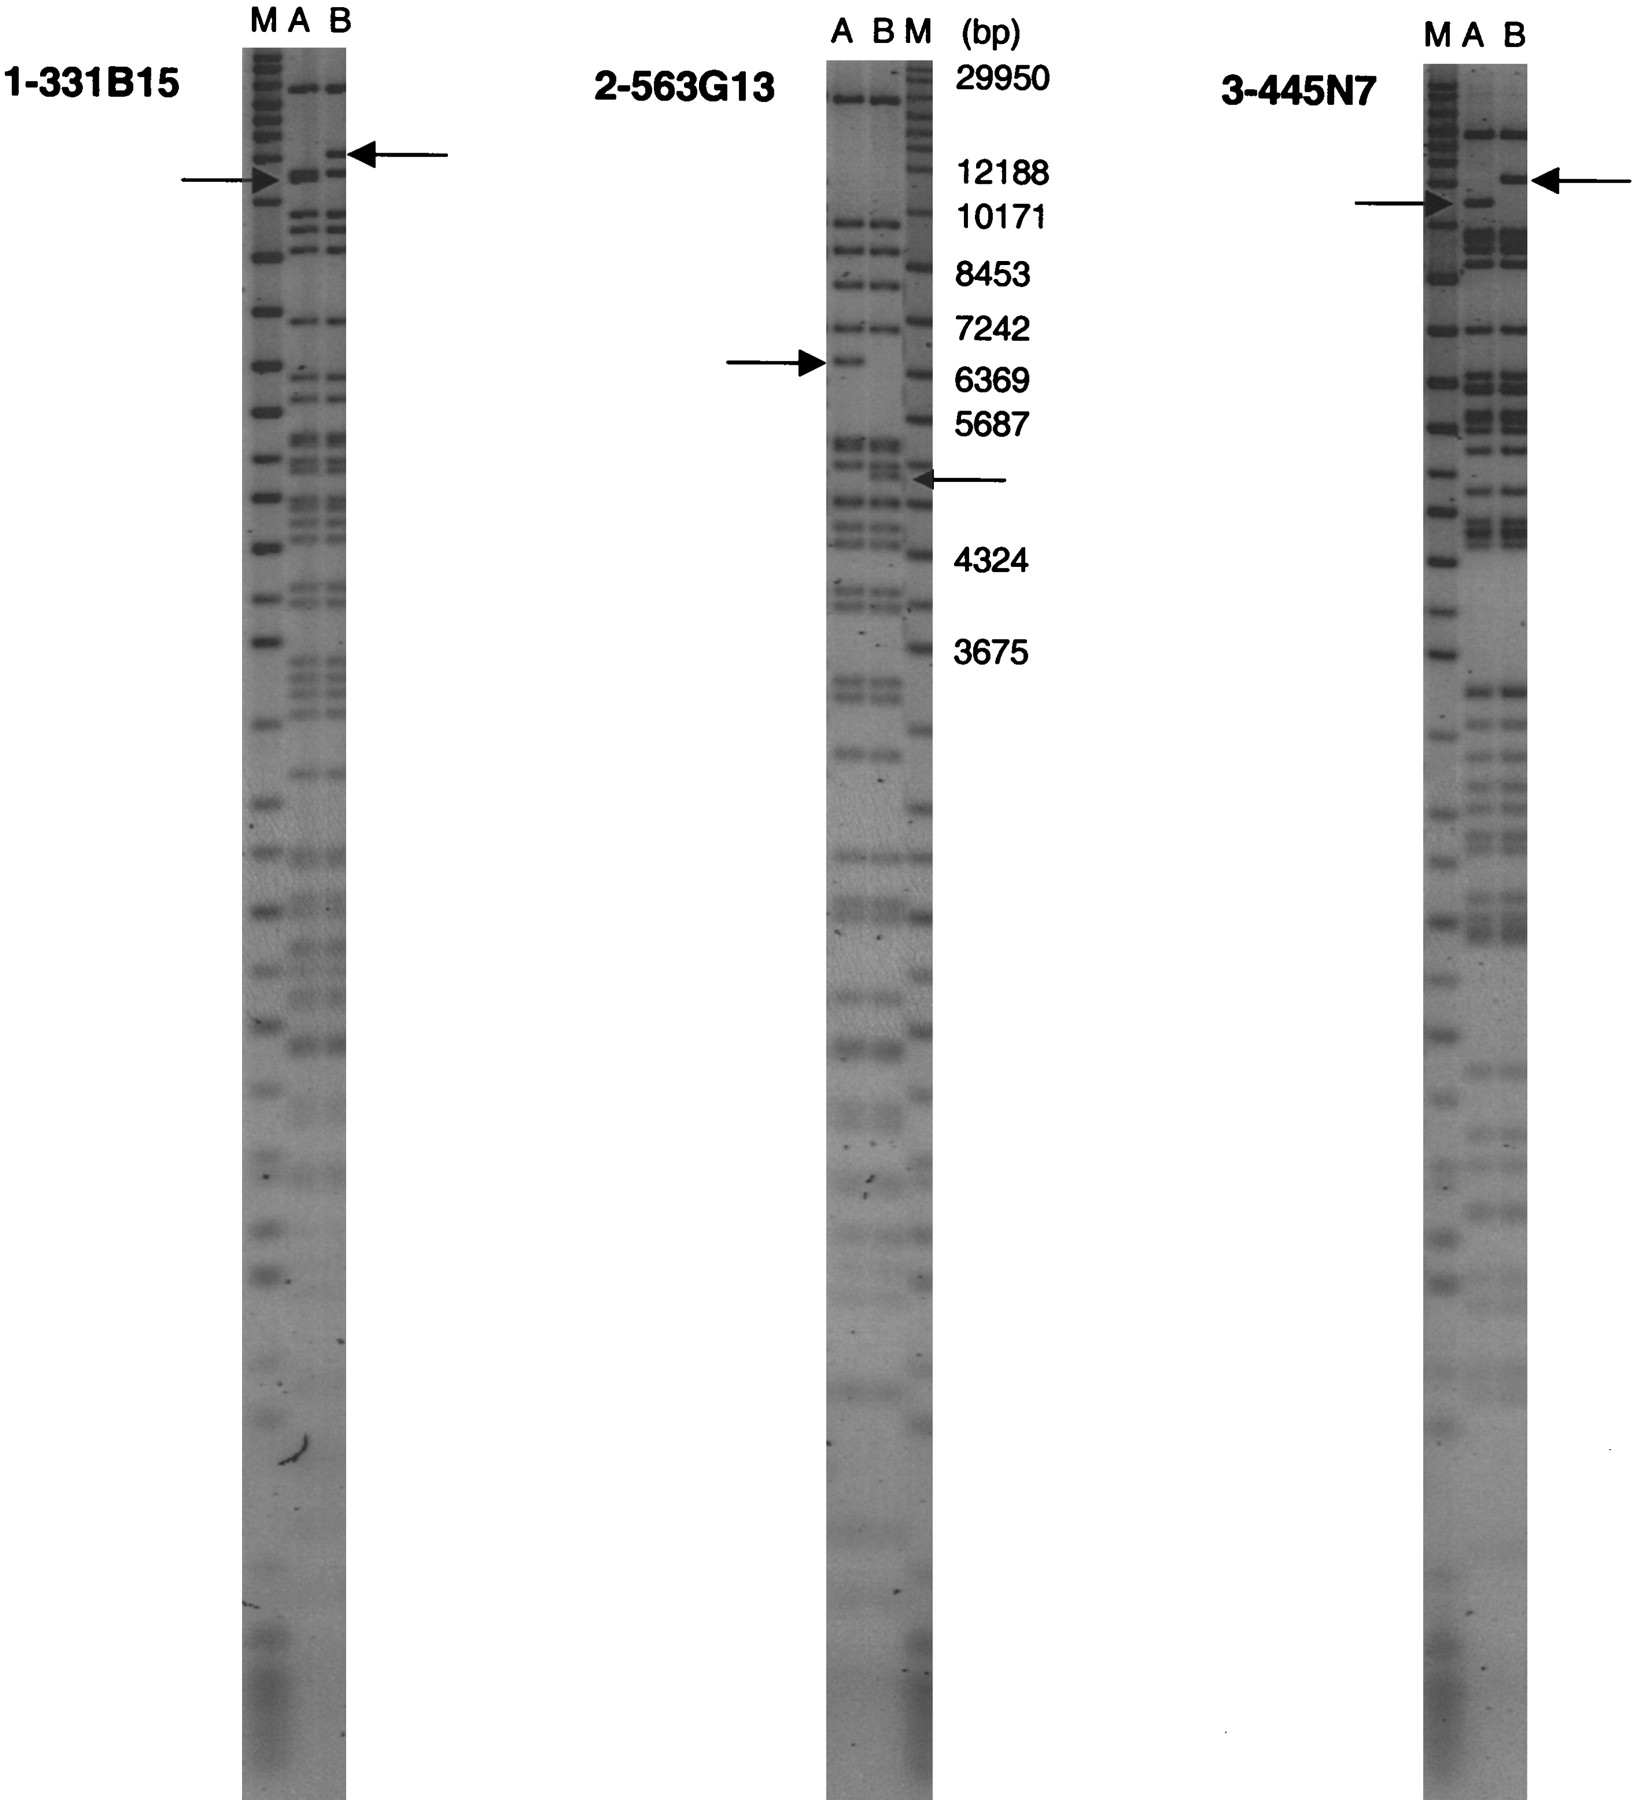
Figure 4.
The clone heterogeneity from fingerprinting gel images. (M) Marker, A and B are derived from different single colonies from the same clone. (center) Some sizes of marker bands are indicated. These fingerprints show a deletion that took place during replication. Arrows indicate inconsistent bands.


