
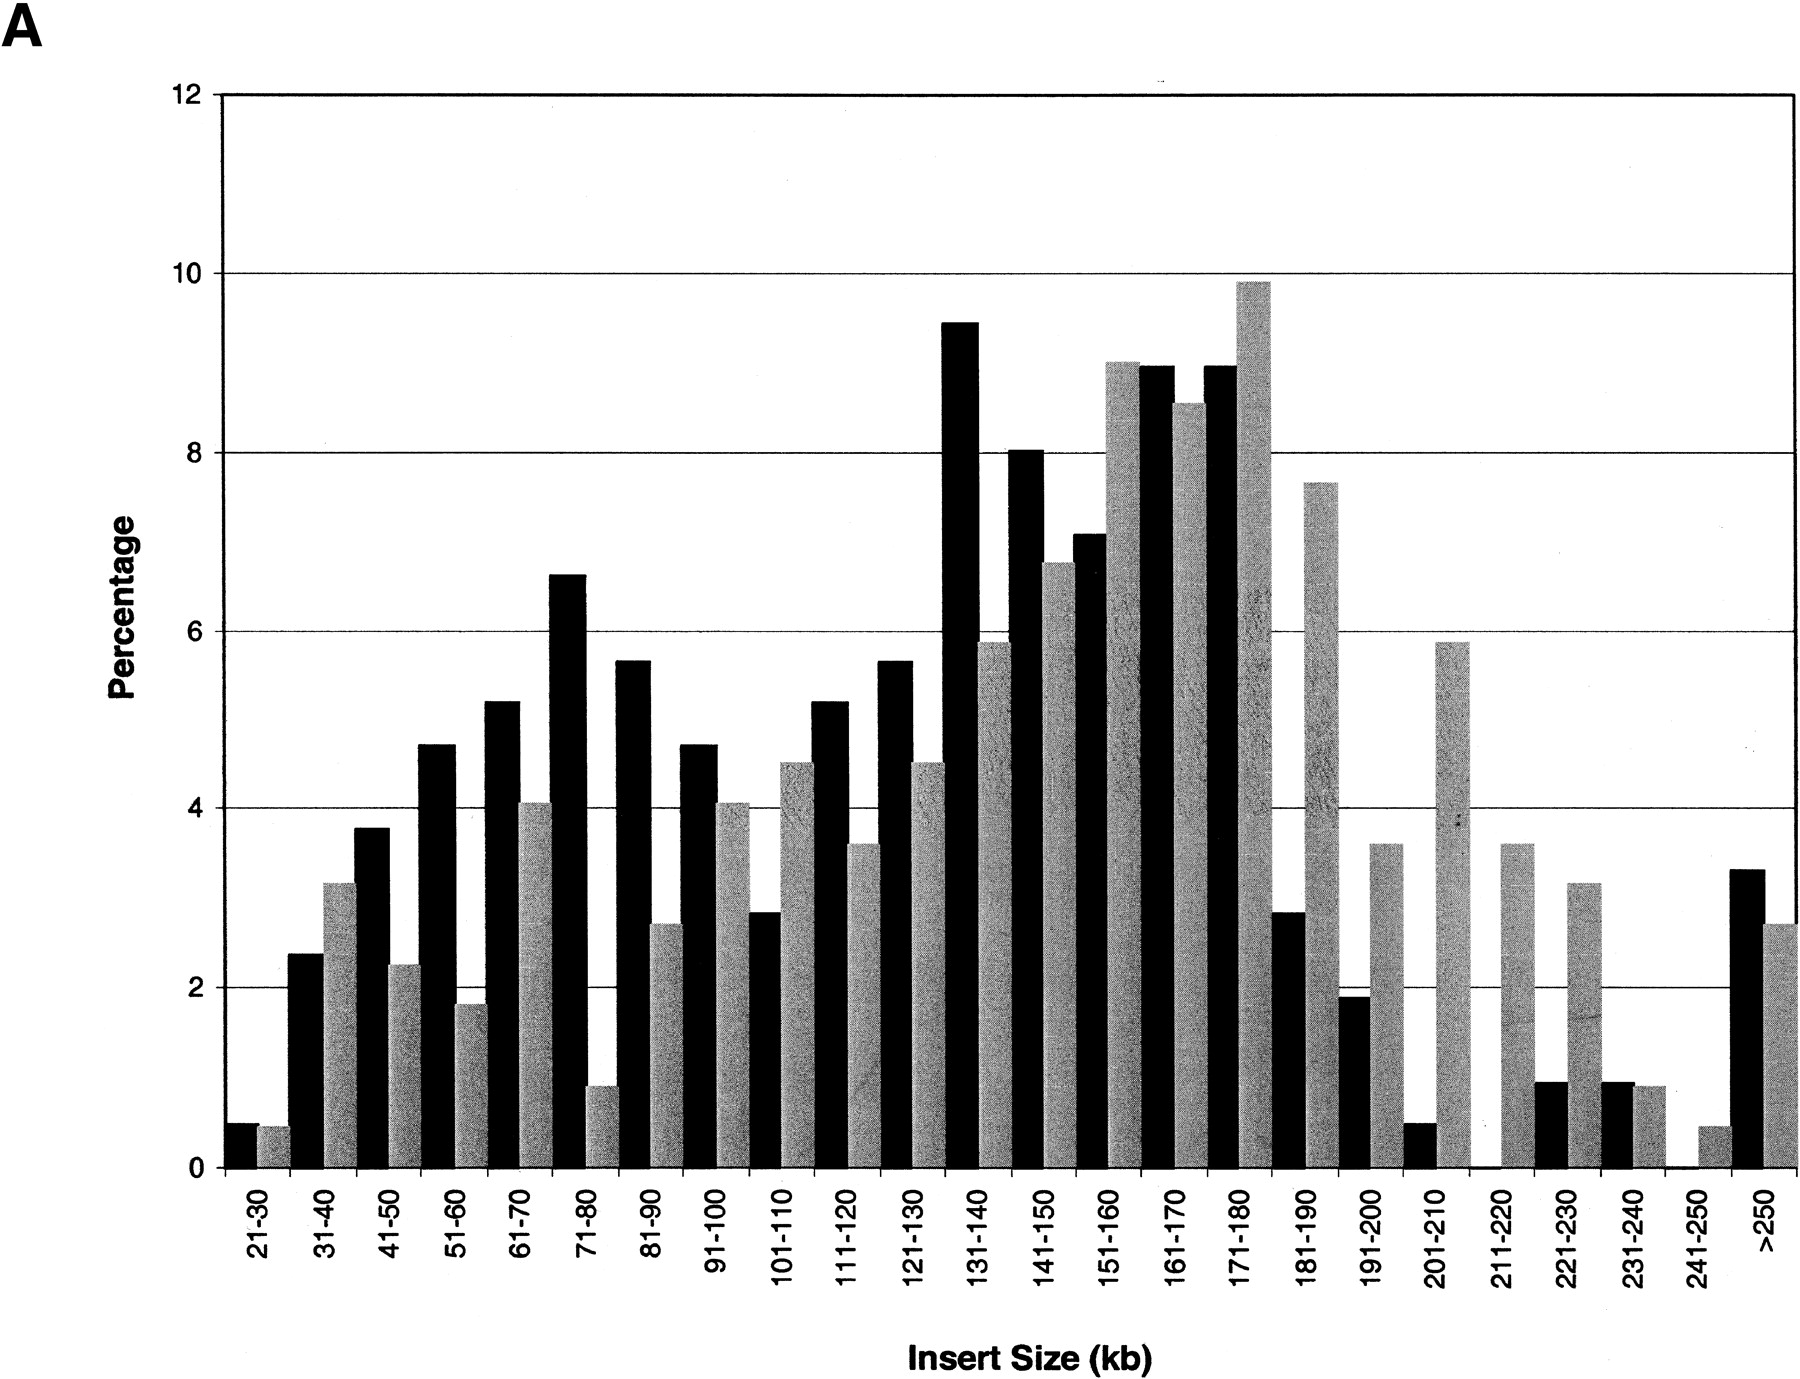

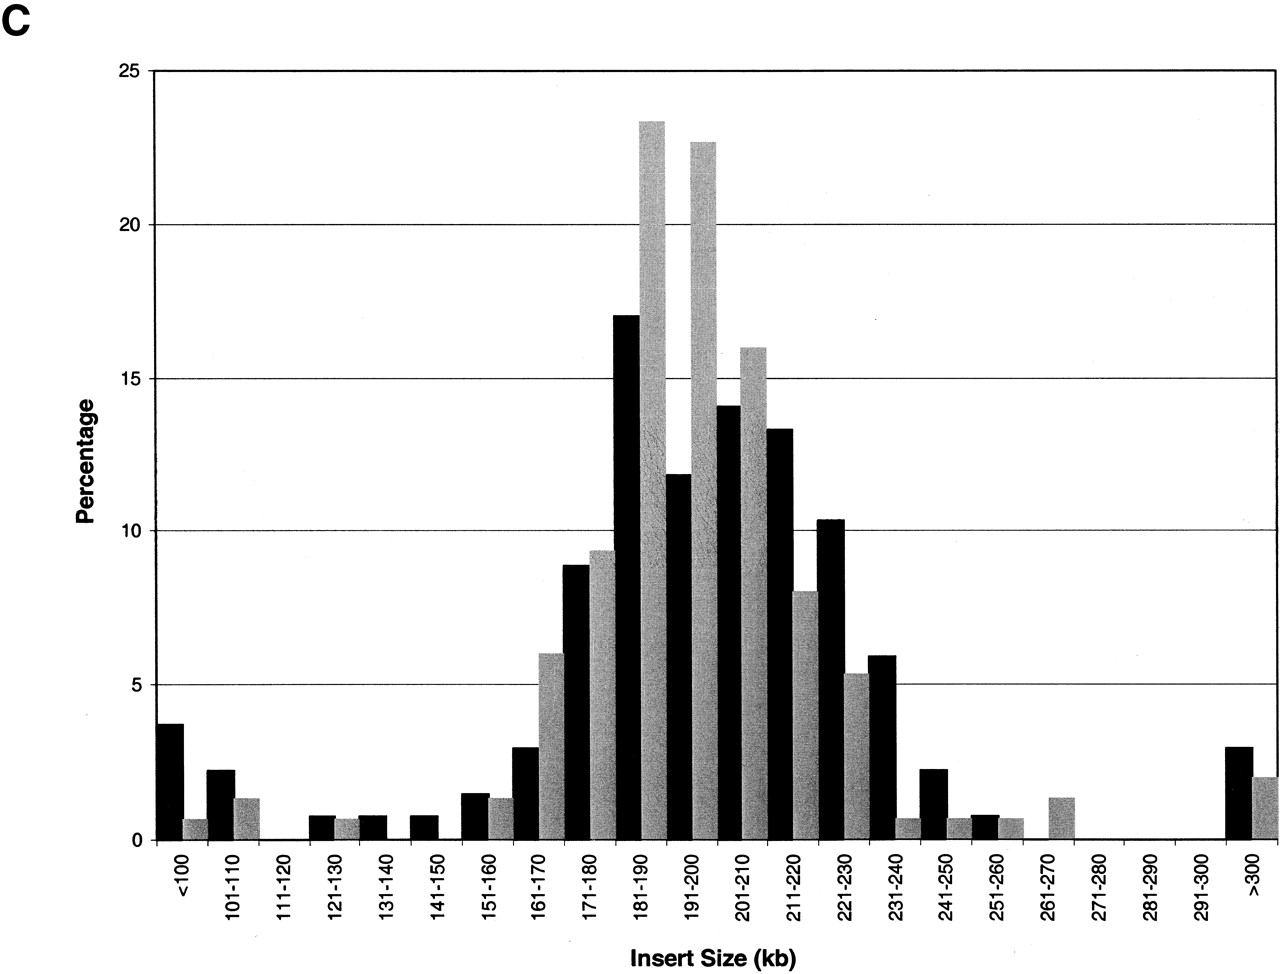
Figure 1.
The insert size distributions of RPCI-21 (A), RPCI-22 (B), and RPCI-23 (C) libraries. A total of 434 clones from RPCI-21, 282 from RPCI-22, and 285 from RPCI-23 were selected randomly, taking separate ligations and transformations into consideration. The horizontal axis refers to the size range of insert DNA, and the vertical axis indicates the percentage of clones corresponding to each size range. Black bars and gray bars correspond to segment 1 and segment 2, respectively.


