
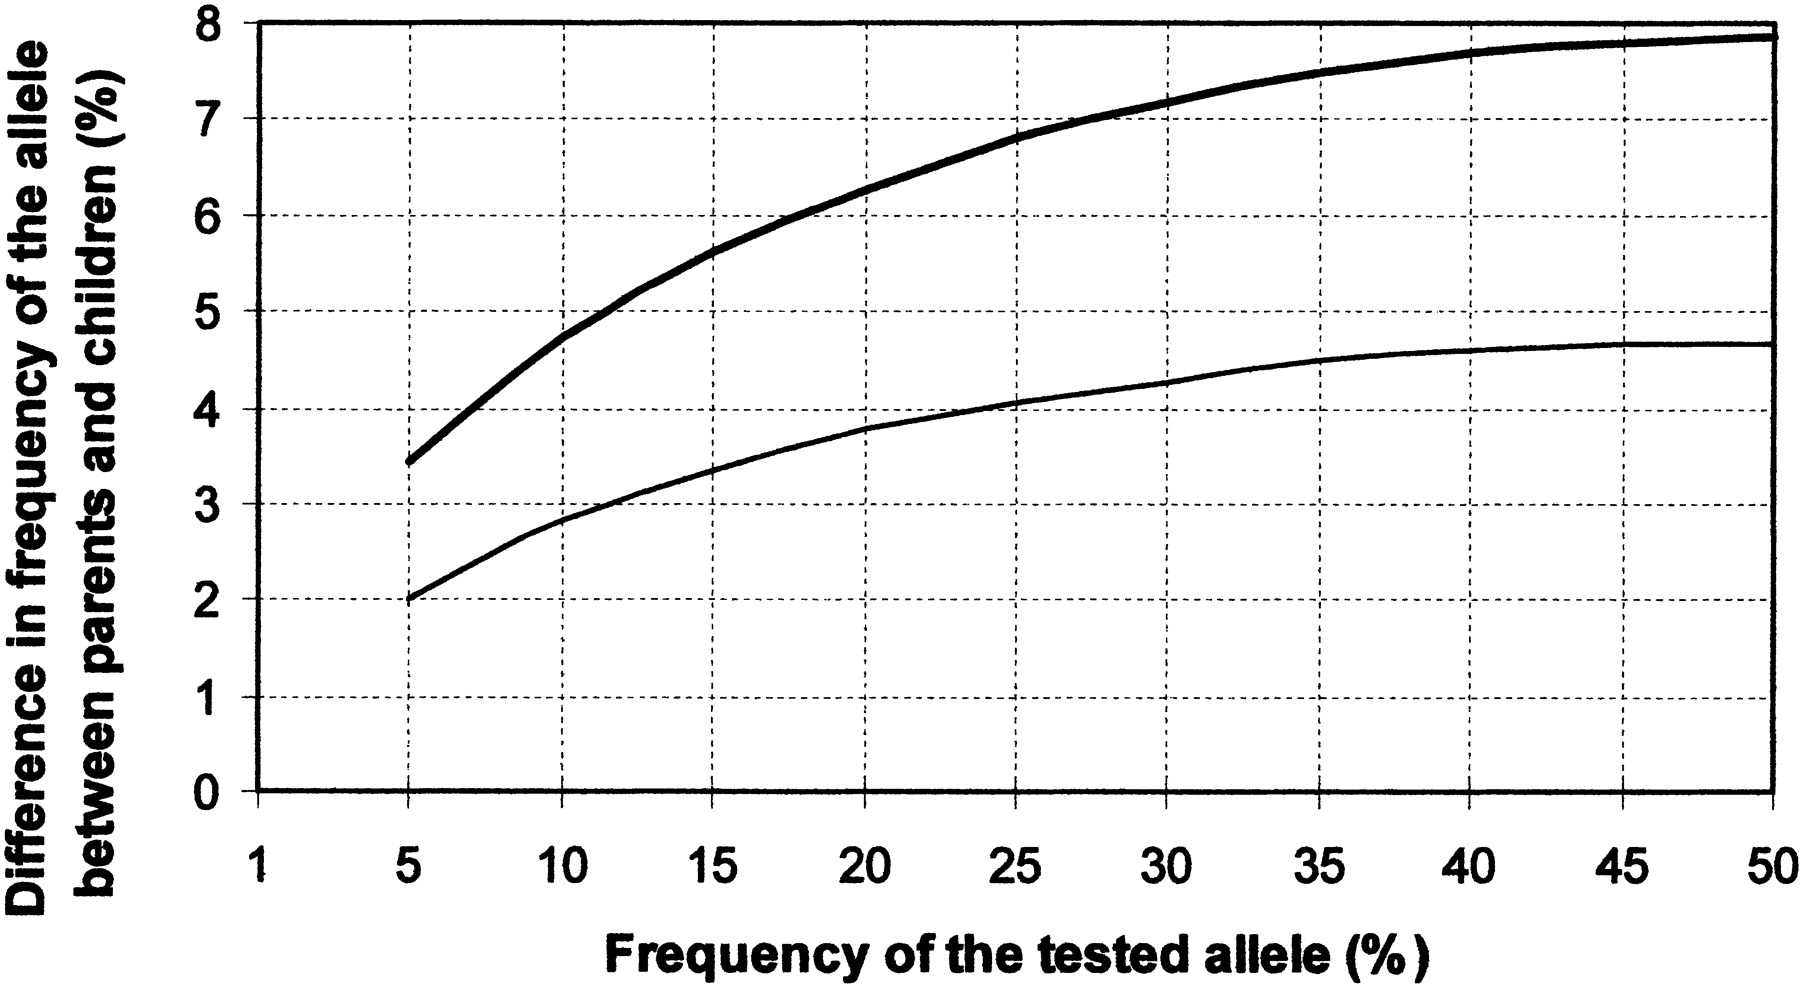
Figure 4.
Allele frequency differences between parents and children for individual alleles that result in significant differences at the 0.05 and 0.001 level (bottom and top lines, respectively). The vertical axis refers to the difference in an allele frequency for a particular allele between parents and offspring, and the horizontal axis refers to the frequency of the allele in parents. These values apply for a sample of 110 trios.


