
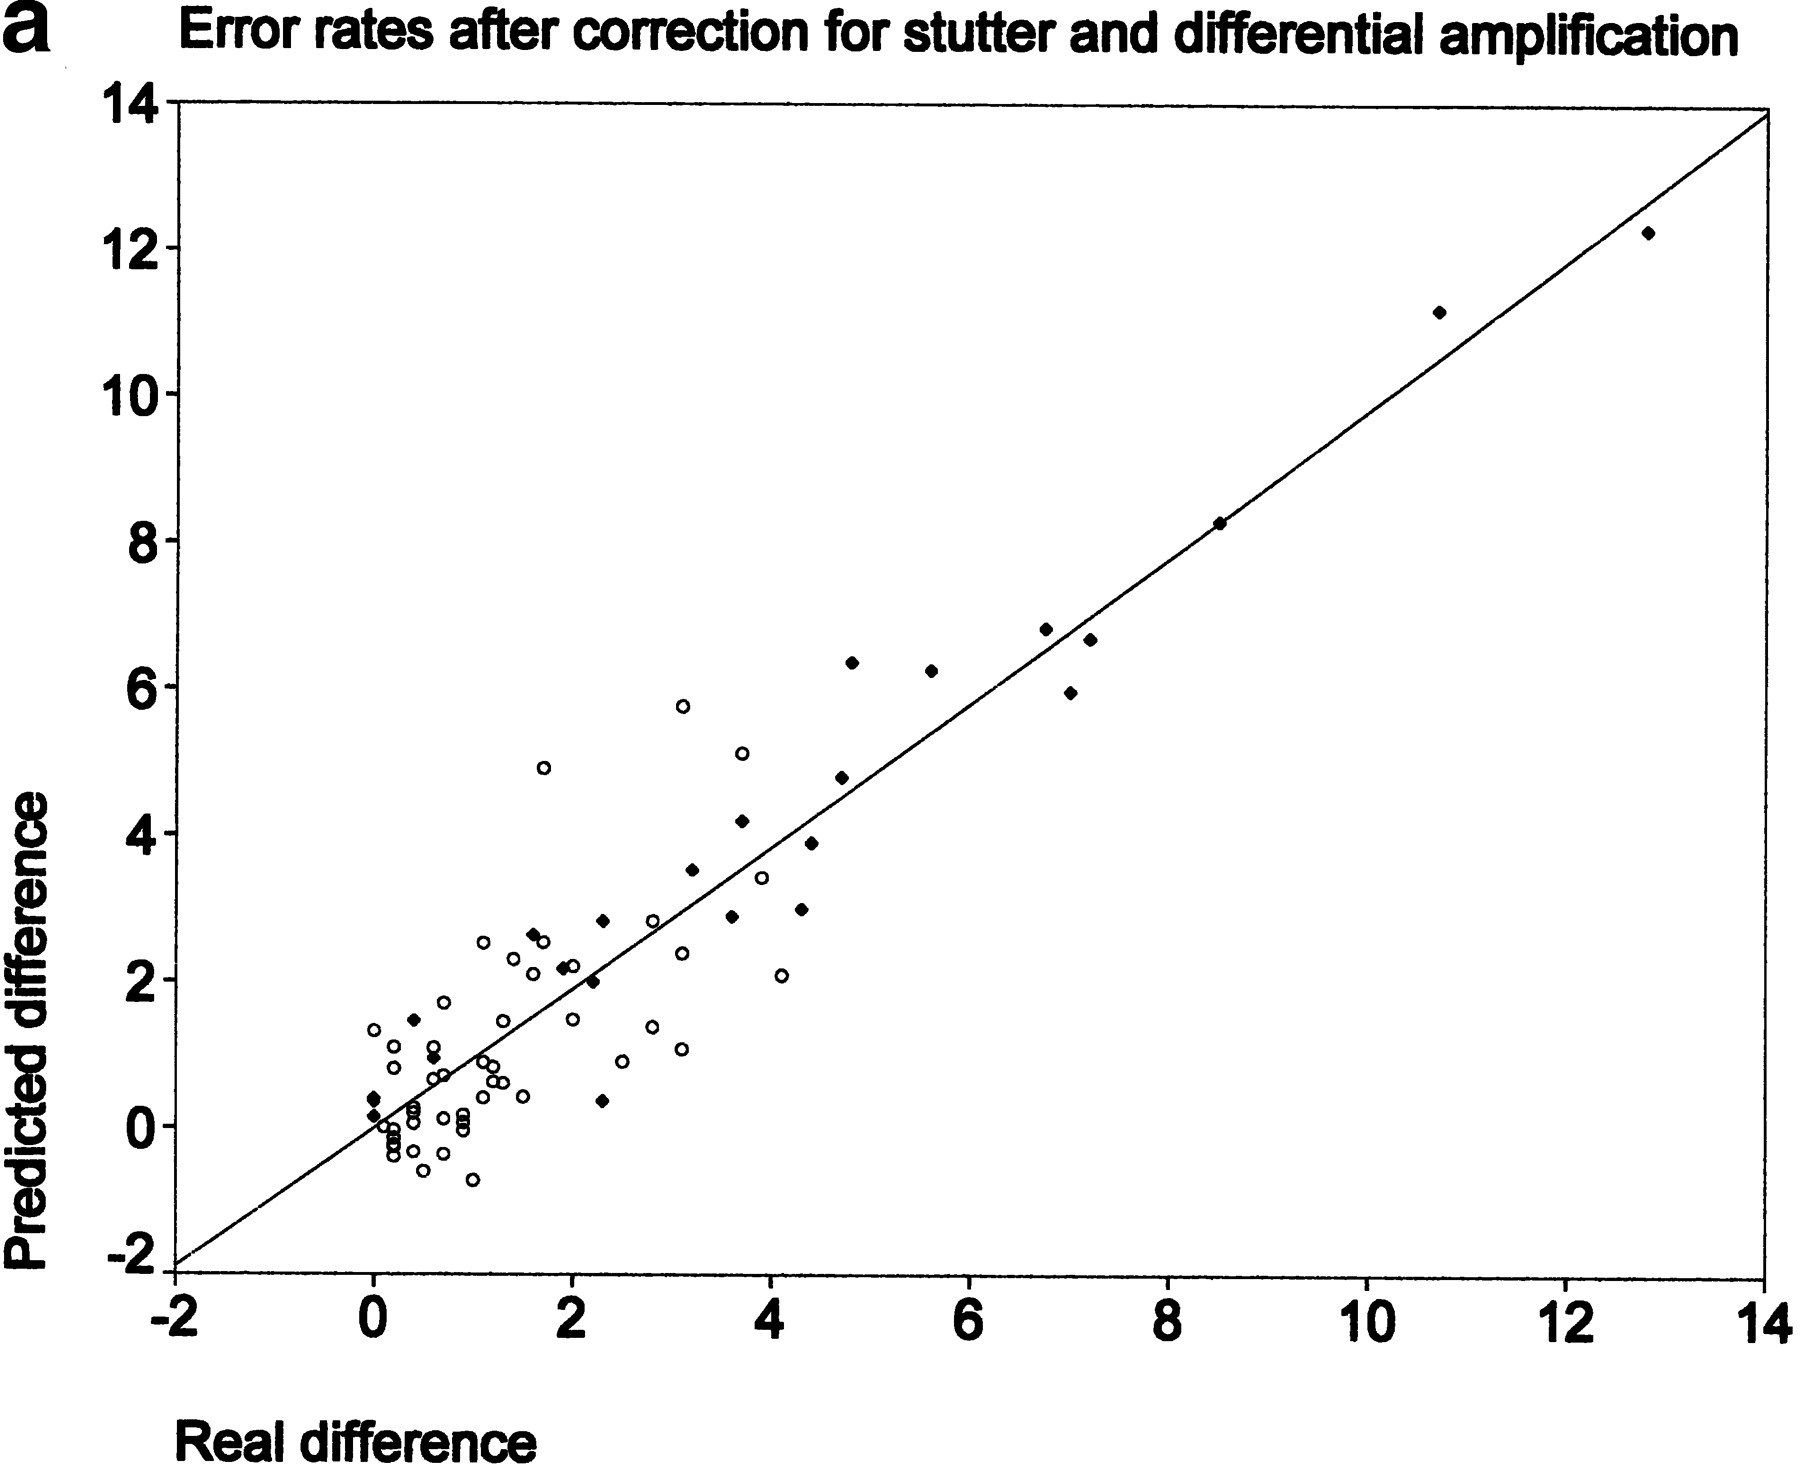
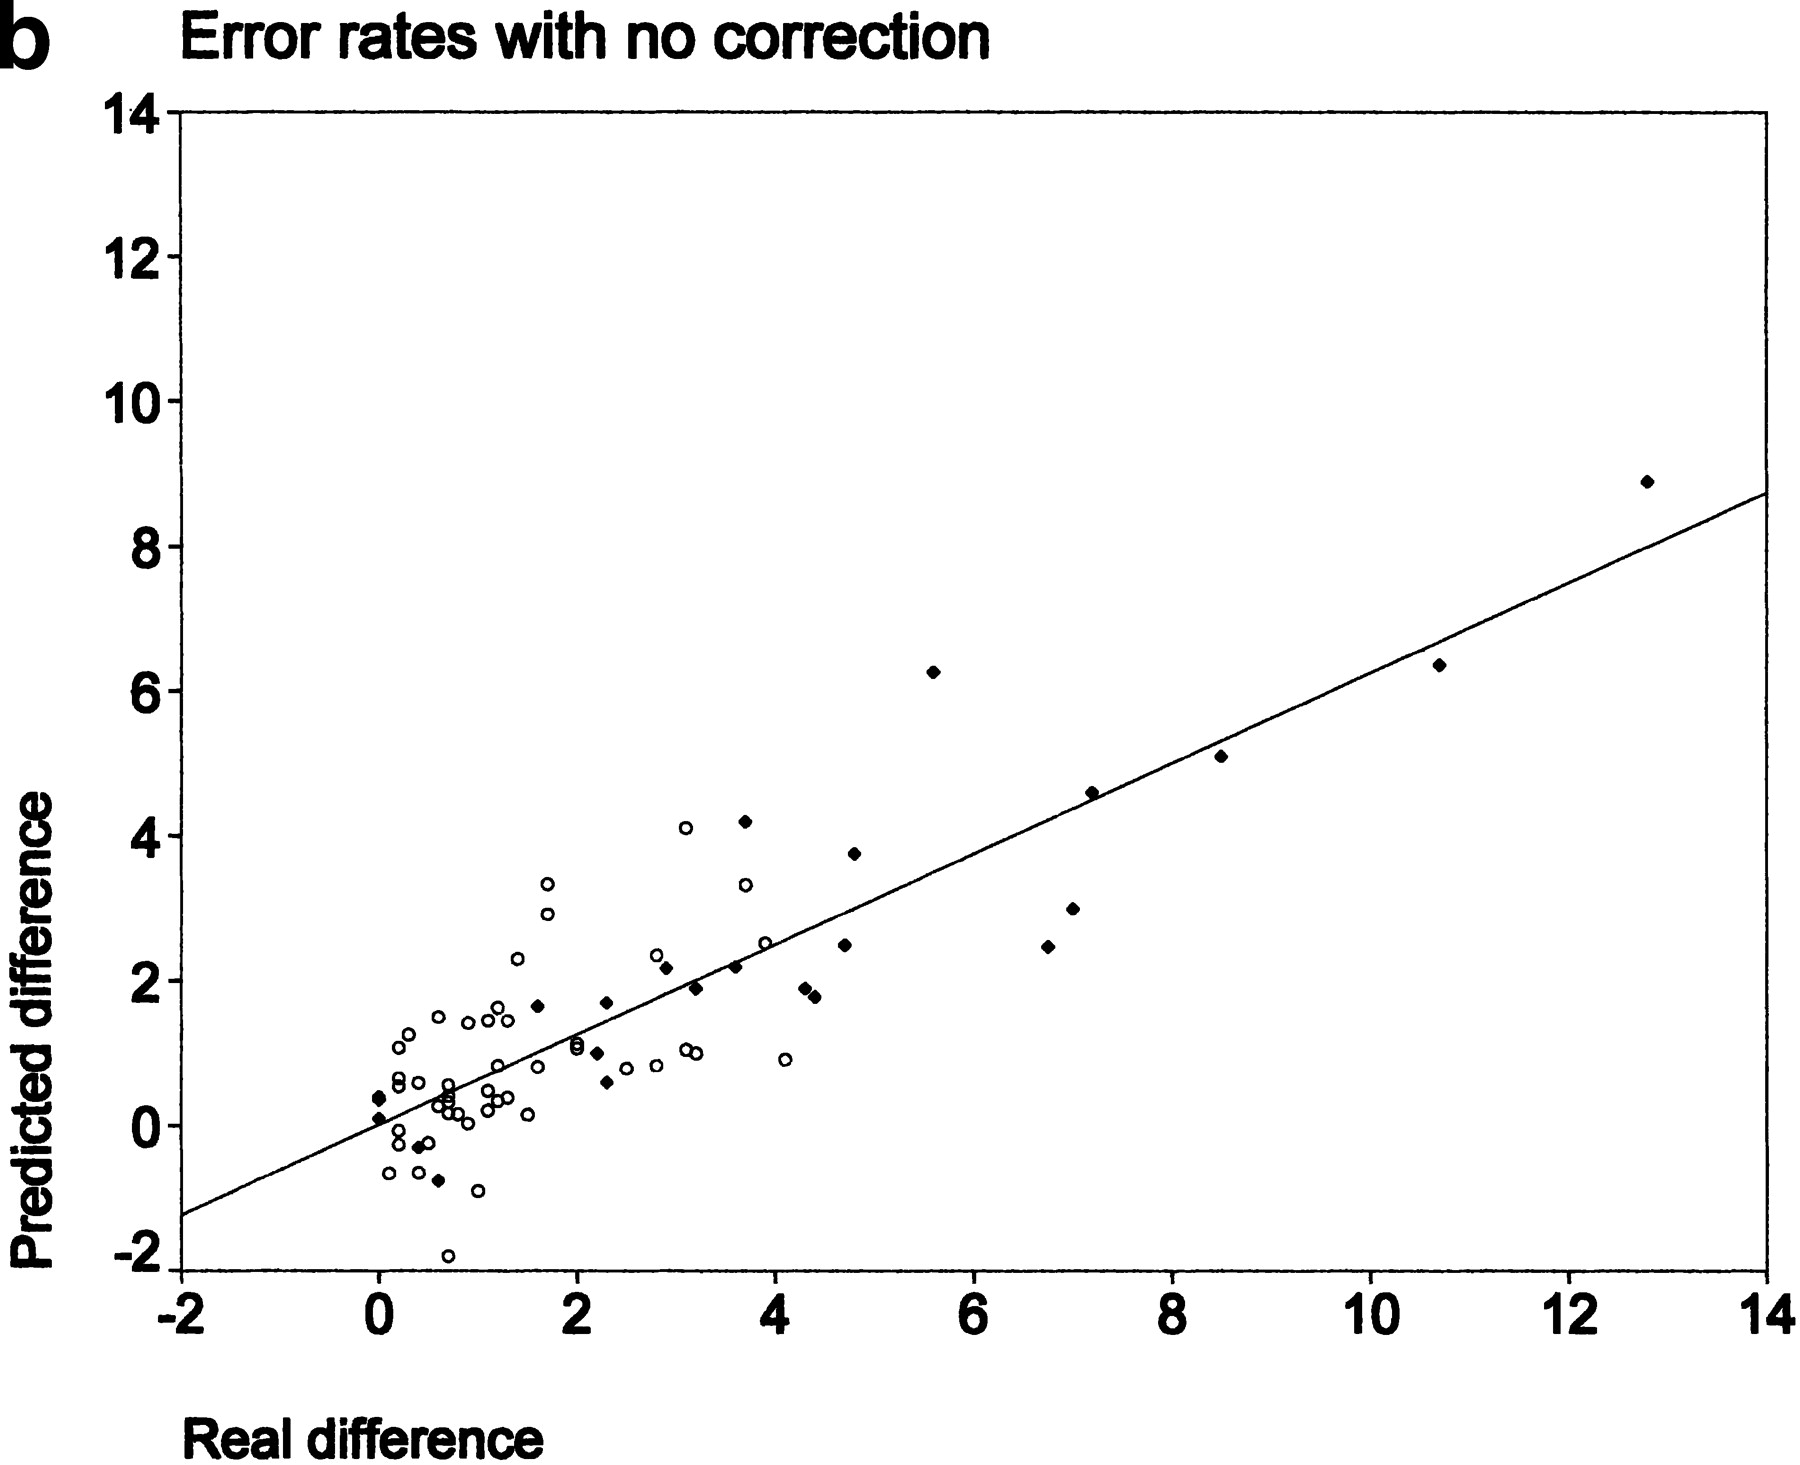
Figure 2.
Comparison between true differences in allele frequencies between samples (x-axis) and predicted differences (y-axis). (○) Parent–offspring results; (♦) spiking experiments. (a) Predictions made after correction for stutter and differential amplification. (b) Predictions made with no correction.


