
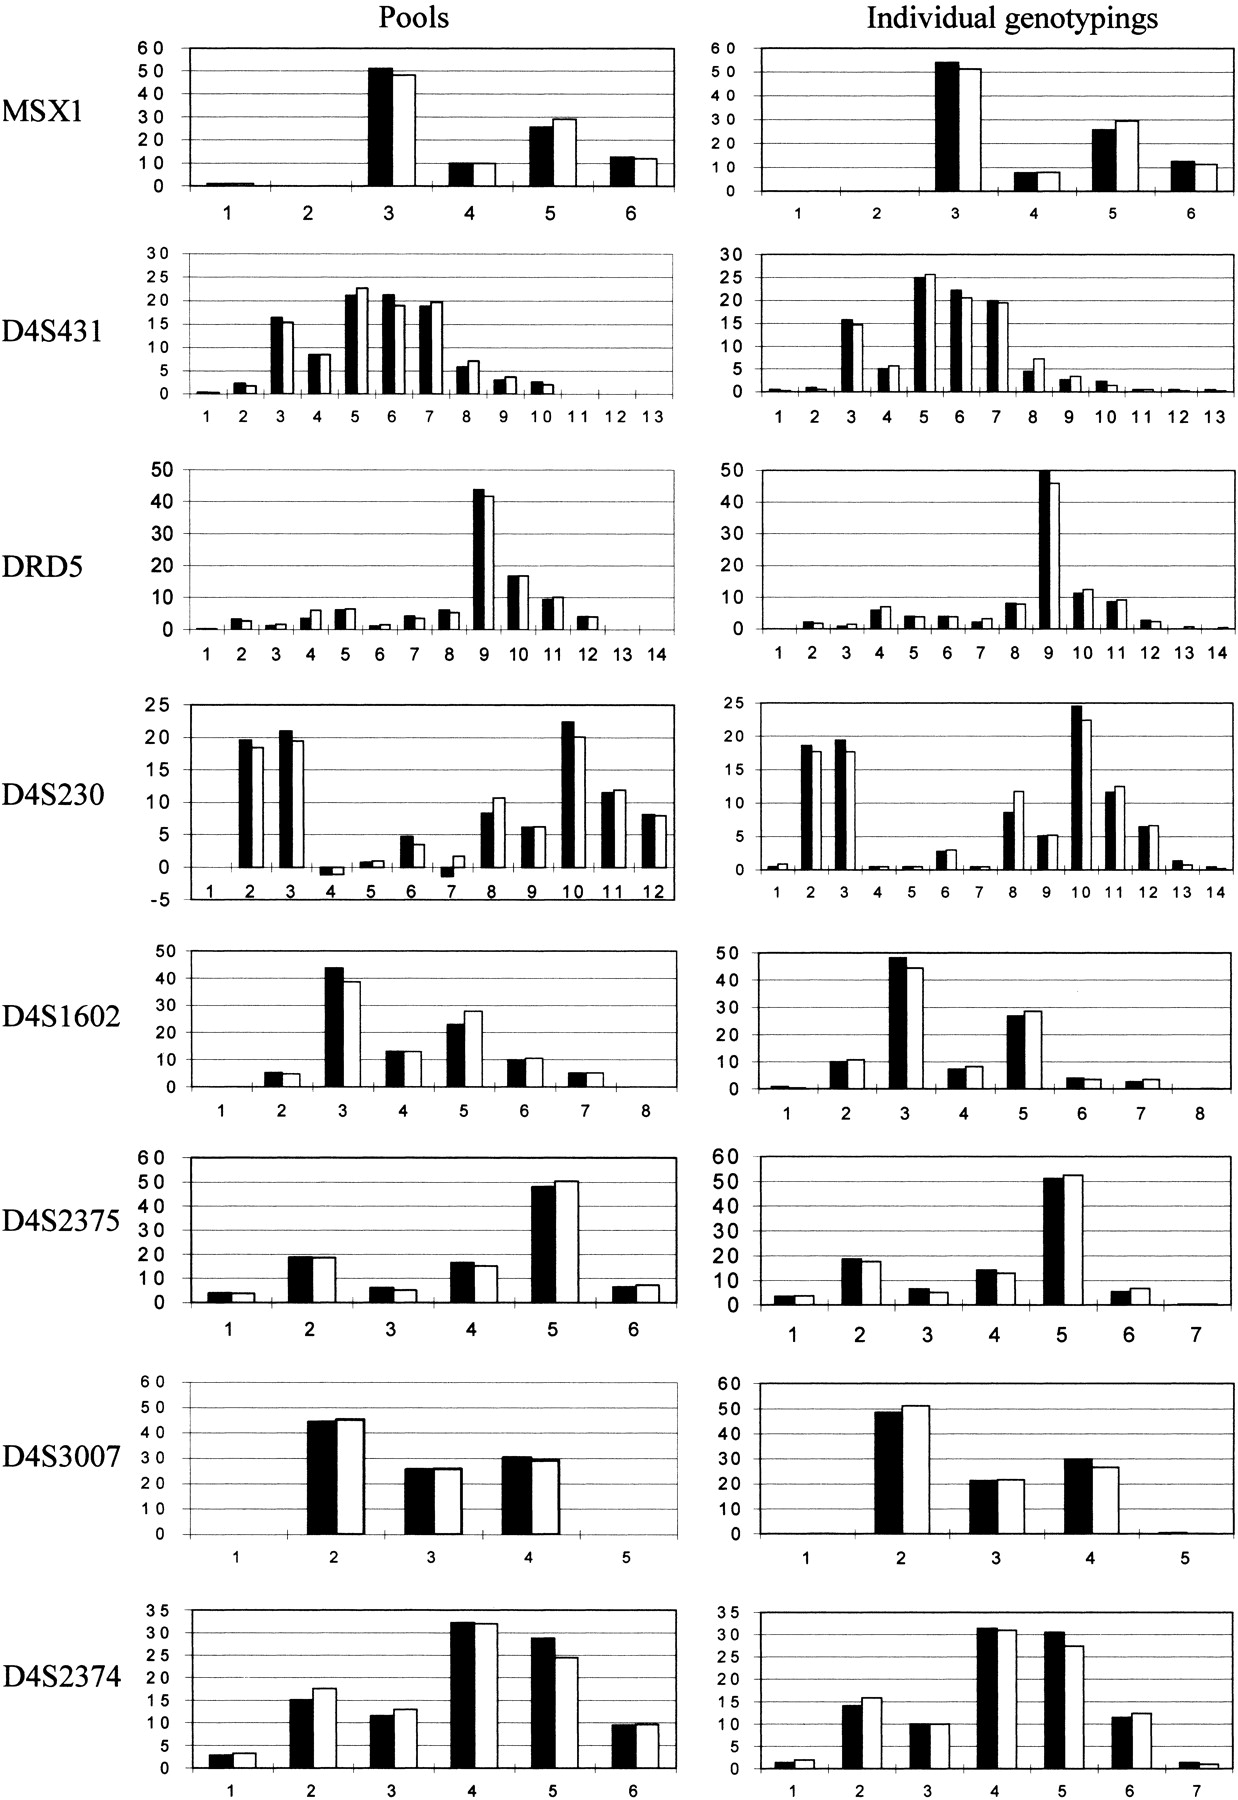
Figure 1.
Allele frequency distributions in parents and their children predicted from pools after correction for stutter and differential amplification (left) and actual allele frequencies produced from individual genotyping (right). (Solid bars) Affected children; (open bars) parents; (horizontal axis) allele numbers; (vertical axis) allele frequency (%). The two negative results for D4S230 are due to overcorrection for stutter of some very rare alleles (<1%). In the analysis these values are taken as zero, but we show the real results in order to highlight this potential problem.


