
Abstract
Most human genes are thought to express different transcript isoforms in different cell types; however, the full extent and functional consequences of polymorphic transcript variation (PTV), which differ between individuals within the same cell type, are unknown. Here we show that PTV is widespread in B-cells from two human populations. Tens of thousands of exons were found to be polymorphically expressed in a heritable fashion, and over 1000 of these showed strong correlations with single nucleotide polymorphism (SNP) genotypes in cis. The SNPs associated with PTV display signs of having been subject to recent positive selection in humans, and they are also highly enriched for SNPs implicated by recent genome-wide association studies of four autoimmune diseases. From this disease-association overlap, we infer that PTV is the likely mechanism by which eight common polymorphisms contribute to disease risk. A catalog of PTV will be a valuable resource for interpreting results from future disease-association studies and understanding the spectrum of phenotypic differences among humans.
The splicing of introns out of pre-mRNAs to create mature mRNAs is an incredibly complex process. Hundreds of proteins and several small nuclear ribonucleoproteins must act in concert to remove introns, whose locations are encoded by a wide array of short sequences in the pre-mRNA. In addition to the well-studied canonical splice donor/acceptor sites and branch sites, many less well-characterized elements known as exonic and intronic splice enhancers and silencers (ESEs, ESSs, ISEs, and ISSs) are also required for proper splicing (Pagani and Baralle 2004). Considering the large fraction of each gene's sequence that is likely involved in directing the splicing machinery, it is fair to say that splicing has a substantial mutational target—that is, mutations in a sizeable fraction of positions within a gene can result in the disruption of splicing. Indeed, ∼15% of known human disease-causing mutations are thought to affect splicing, and even this may be a serious underestimate (Pagani and Baralle 2004).
Nearly all studies of the role of polymorphic transcript variation (PTV) in human disease have focused on highly penetrant Mendelian diseases caused by rare genetic variants that disrupt normal splicing (Krawczak et al. 1992; Baralle and Baralle 2005). Such rare variants are often found within splice donor/acceptor or branch point sites and usually have a severe effect on the splicing of some exon(s). Much more challenging has been connecting common genetic variation affecting PTV to complex multigenic diseases, in large part because of the less pronounced effects such variants may have on both splicing and disease. Nevertheless, several examples of associations between common variants affecting both PTV and disease risk have been reported, including splicing of IRF5, OAS1, CTLA4, and PTPRC (formerly known as CD45) in several autoimmune diseases (Lynch and Weiss 2001; Ueda et al. 2003; Fedetz et al. 2006; Graham et al. 2007; Kozyrev et al. 2007), and NPSR1 (also known as GPRA) in asthma (Laitinen et al. 2004). These examples, while few in number, suggest that a systematic study of PTV may reveal more cases like these.
The cell lines genotyped by the International HapMap Consortium represent an ideal resource for investigating PTV. These 270 Epstein-Barr virus-transformed lymphoblastoid B-cell lines, representing four human populations, have been genotyped at approximately 3.1 million common single nucleotide polymorphisms (SNPs) as part of the Phase II HapMap project (The International HapMap Consortium 2007). These cell lines have been used to study variation in gene expression levels (Stranger et al. 2007), and a subset of the samples from a single population has been used to study PTV (Kwan et al. 2008). Here, we examine a much larger sample of individuals from two distinct populations to more comprehensively uncover the extent of PTV, its genetic control, and its role in complex disease.
Results
To investigate the extent of PTV in humans, we analyzed a data set of approximately 1.4 million individual exon expression levels, represented by ∼6 million 25-mer microarray probes, in lymphoblastoid cell lines derived from 176 humans (Huang et al. 2007). The cell lines have been extensively genotyped by the HapMap project (The International HapMap Consortium 2007); 89 are from a Yoruban population in Ibadan, Nigeria (YRI), and 87 are from residents of Utah with European ancestry (CEPH). The samples mostly consist of family trios, which are groups of two parents and one child. We used only the approximately 171,000 probe sets present in RefSeq genes and not overlapping any known SNPs; each probe set typically consists of four probes that all hybridize to a single exon. After quantile normalization, the relative expression of each probe set was estimated by dividing the probe set intensity by the overall intensity of the gene in each individual, so that differences in this normalized expression between individuals are independent of differences in “entire gene” expression levels (Clark et al. 2007).
Heritability of PTV
To estimate the narrow-sense heritability (h2, the fraction of total variability explained by additive genetic variation) of PTV, we took advantage of the family trios in the data set by comparing each normalized probe set expression level in parents and their children. The observed distribution of heritabilities (Fig. 1A, blue line) is clearly shifted toward higher values than the distribution expected by chance (Fig. 1A, red line), indicating nonrandom heritability of PTV. In fact, 38,264 probe sets (22.4%) show greater heritability than expected by chance. Gender did not associate with PTV more than expected by chance, and adjusting for gender in the heritability calculations did not substantially affect our results (see Methods and Supplemental Fig. 1).
Heritable probe sets in lymphoblastoid cell lines. (A) The distribution of heritabilities (h2) for the normalized expression of 170,956 probe sets. The observed distribution (blue line) is shifted toward higher heritabilities, as compared to the expected distribution from permutation testing (red line). Of the probe sets, 22.4% fall to the right of the expected distribution, indicating that these are more heritable than random. (B) The locations of the 6536 most heritable (h2 > 0.6 from A) probe sets within genes. Most probe sets occur within coding exons, although more occur in 3′-UTRs than expected by chance.

To find any commonalities among the genes containing the most heritable exons, we searched the Gene Ontology (GO) (The Gene Ontology Consortium 2000) and Protein Information Resource (PIR) (Wu et al. 2003) databases for enrichments. Among the set of genes containing at least one of the 6536 probe sets with parent–child h2 > 0.6 (estimated false discovery rate, [FDR] = 5.2%; Supplemental Table 1), the most significant enrichment by far was for the PIR category of genes known to be alternatively spliced (P < 10−144), indicating that our results are consistent with previously discovered transcript variation. This overlap may be due to a bona fide association of alternative and polymorphic splicing, or instead may be due to the fact that nearly all studies of alternative splicing across human tissues have used different tissues from different individuals, thus conflating alternative and polymorphic splicing in their analyses. Other enrichments included proteins that are phosphorylated, localize to the nucleus, or bind ATP.
Well over half (62.1%) of these heritable probe sets overlap coding exons, and thus alter amino acid sequences, whereas the rest (37.9%) fall in 5′- or 3′-UTRs (Fig. 1B, red bars). The strongest enrichment is in 3′-UTRs, where 27.2% of the heritable probe sets reside, compared to 17.0% expected by chance (see Fig. 3A below, blue bars). This has particular implications for the interpretation of oligonucleotide microarray expression data, since probes in these arrays are usually located only at the 3′-ends of transcripts; thus, a signal that appears to indicate differential expression of a gene may, in fact, indicate differential inclusion of alternate 3′-UTRs. For example, 536 probe sets in the Affymetrix U133 Plus 2.0 microarray (Supplemental Table 2) overlap in the genome with one of the 6536 most heritable exon array probe sets, so any differences in these U133 probe sets seen in samples from different individuals should be interpreted with caution.
Polymorphisms influencing PTV
Next, we searched for polymorphisms that might influence PTV. Comparing the probe set normalized intensities to all approximately 3.1 million SNPs genotyped in these samples by the HapMap project (The International HapMap Consortium 2007), we found that the vast majority of significant correlations occurred between SNPs and probe sets in close genomic proximity, implying that the strongest effects of genetic polymorphisms on PTV occur in cis. For this reason, we restricted our analyses for each probe set to SNPs located within 100 kb of that probe set. (Although copy-number polymorphisms could cause PTV by altering the copy number of a subset of exons within a gene, we did not find any evidence supporting a widespread role for this [see Supplemental Note].)
We compiled two lists of correlated probe set/SNP pairs, one “high-confidence” and one “medium-confidence” (see Methods and Supplemental Tables 3 and 4). The high-confidence list contains 461 probe sets (12 expected by chance, 2.6% FDR) in 380 genes correlating with 5688 SNPs, whereas the medium-confidence list consists of 1061 probe sets (94 expected, 8.8% FDR) in 793 genes and 10,206 SNPs. We assessed the accuracy of these lists in two ways. First, we tested their overlap with results from a previous, smaller study of PTV using exon microarrays (Kwan et al. 2008) and found more than 50-fold more overlap than expected by chance (see Discussion). Second, we compiled a list of 20 candidate PTV events from our medium-confidence list that were tested by real-time RT-PCR (Kwan et al. 2008). Of the 20 candidates, 16 (80%) were confirmed as being significantly associated with nearby SNP genotypes in the CEPH cell lines. We also tested the possibility of unannotated SNPs disrupting probe hybridization and leading to spurious correlations with nearby HapMap SNP genotypes in two ways. First, we estimated that only ∼8/461 probe sets in our high-confidence list would be influenced by unannotated SNPs, based on the fraction of probe sets overlapping known SNPs (which had been removed from our analysis; see Methods). Second, among our high-confidence hits tested by RT-PCR, none contained any unannotated SNPs within the probe sequences (Kwan et al. 2008), in support of our calculations that indicated that unannotated SNPs do not present a major problem for this analysis.
The 20 most significant hits from the high-confidence list are shown in Table 1. Nearly all (16/20, 80%) of the affected probe sets are in 3′-UTRs, almost three times the frequency among all highly heritable probe sets (Fig. 1B), suggesting that variation near the 3′-ends of transcripts (including alternative 3′-UTRs and alternative polyadenylation sites) tends to show the strongest genetic determination. The top two genes (IRF5 and OAS1) (Fig 2A,B; Table 1) have both previously been shown to exhibit genetically controlled PTV in these cell lines (Bonnevie-Nielsen et al. 2005; Graham et al. 2007; Kwan et al. 2007). IRF5 is a transcription factor that acts downstream from Toll-like receptors and has been implicated as a cause of systemic lupus erythematosus (SLE) (Graham et al. 2007). A SNP in the polyadenylation site of the 3′-UTR leads to an ∼650-bp extension of the transcript in some HapMap cell lines (Graham et al. 2007). The most significant probe set can hybridize only to the extended transcript variant and can thus differentiate between them; as shown in Figure 2A, not a single CEPH individual overlaps in expression level of this probe set between genotypes (P < 10−89). OAS1 is an enzyme involved in innate antiviral response with splice variants that are known to affect susceptibility to viral infection (Bonnevie-Nielsen et al. 2005) and multiple sclerosis (Fedetz et al. 2006). The same splice site SNP known to associate with disease susceptibility was recently shown also to associate with splicing of OAS1 in CEPH cell lines (Kwan et al. 2007), a finding that is confirmed by our analysis (Supplemental Fig. 2; P < 10−40). Interestingly, a probe that hybridizes specifically to yet another known splice form of OAS1 is an even stronger hit in our analysis (Fig. 2B; P < 10−65).
Examples of high-confidence transcript variant-genotype associations. For each gene, we show a subset of its exons (tall blue boxes indicate coding regions, shorter blue boxes indicate UTRs; transcription proceeds from left to right) in two known or predicted transcript variants, with (red bar) the location of the relevant probe set. (A–H, right panels) The data underlying each probe set's best genotype association.

The top 20 genes in the high-confidence list

[i] Distances to splice sites are given only to the closer of the two sites for the relevant exon; negative distances indicate upstream SNPs. Fisher's combined P-values are given as −log10 values. When multiple RefSeq or SNP IDs apply, one was chosen randomly. aThe SNP was below 10% MAF in the YRI population.
Next, we examined the spatial distribution of PTV-associated SNPs. We first restricted our attention to within several hundred base pairs of the exon boundaries, a region within which nearly all previously reported splicing enhancers/silencers have been located (Ladd and Cooper 2002). We find the greatest density of SNPs inside the exons but quite close to the exon boundaries, within 100 bp of either splice site (Fig. 3A). The peak enrichments are even more significant when considered as proportions of all SNPs, because the overall density of SNPs is known to decrease near exon boundaries (Fairbrother et al. 2004). Interestingly, the SNPs are not as greatly enriched in the canonical splice sites themselves, in contrast to rare SNPs that cause highly penetrant disease phenotypes by affecting splicing (Krawczak et al. 1992); this may be because splice site mutations tend to be drastic events that will often be selected against, and thus are underrepresented among common SNPs.
Spatial distributions of transcript variant-associated SNPs. (A) The distribution of medium-confidence SNPs within several hundred base pairs of splice sites. The greatest densities are inside the exons (gray box), within 100 bp of the exon boundaries. (B) The distribution of (black bars) all medium-confidence SNPs, shown as the distance from the center of the affected exon. There is a peak near zero, and more than half of all SNPs occur within 30 kb on either side.
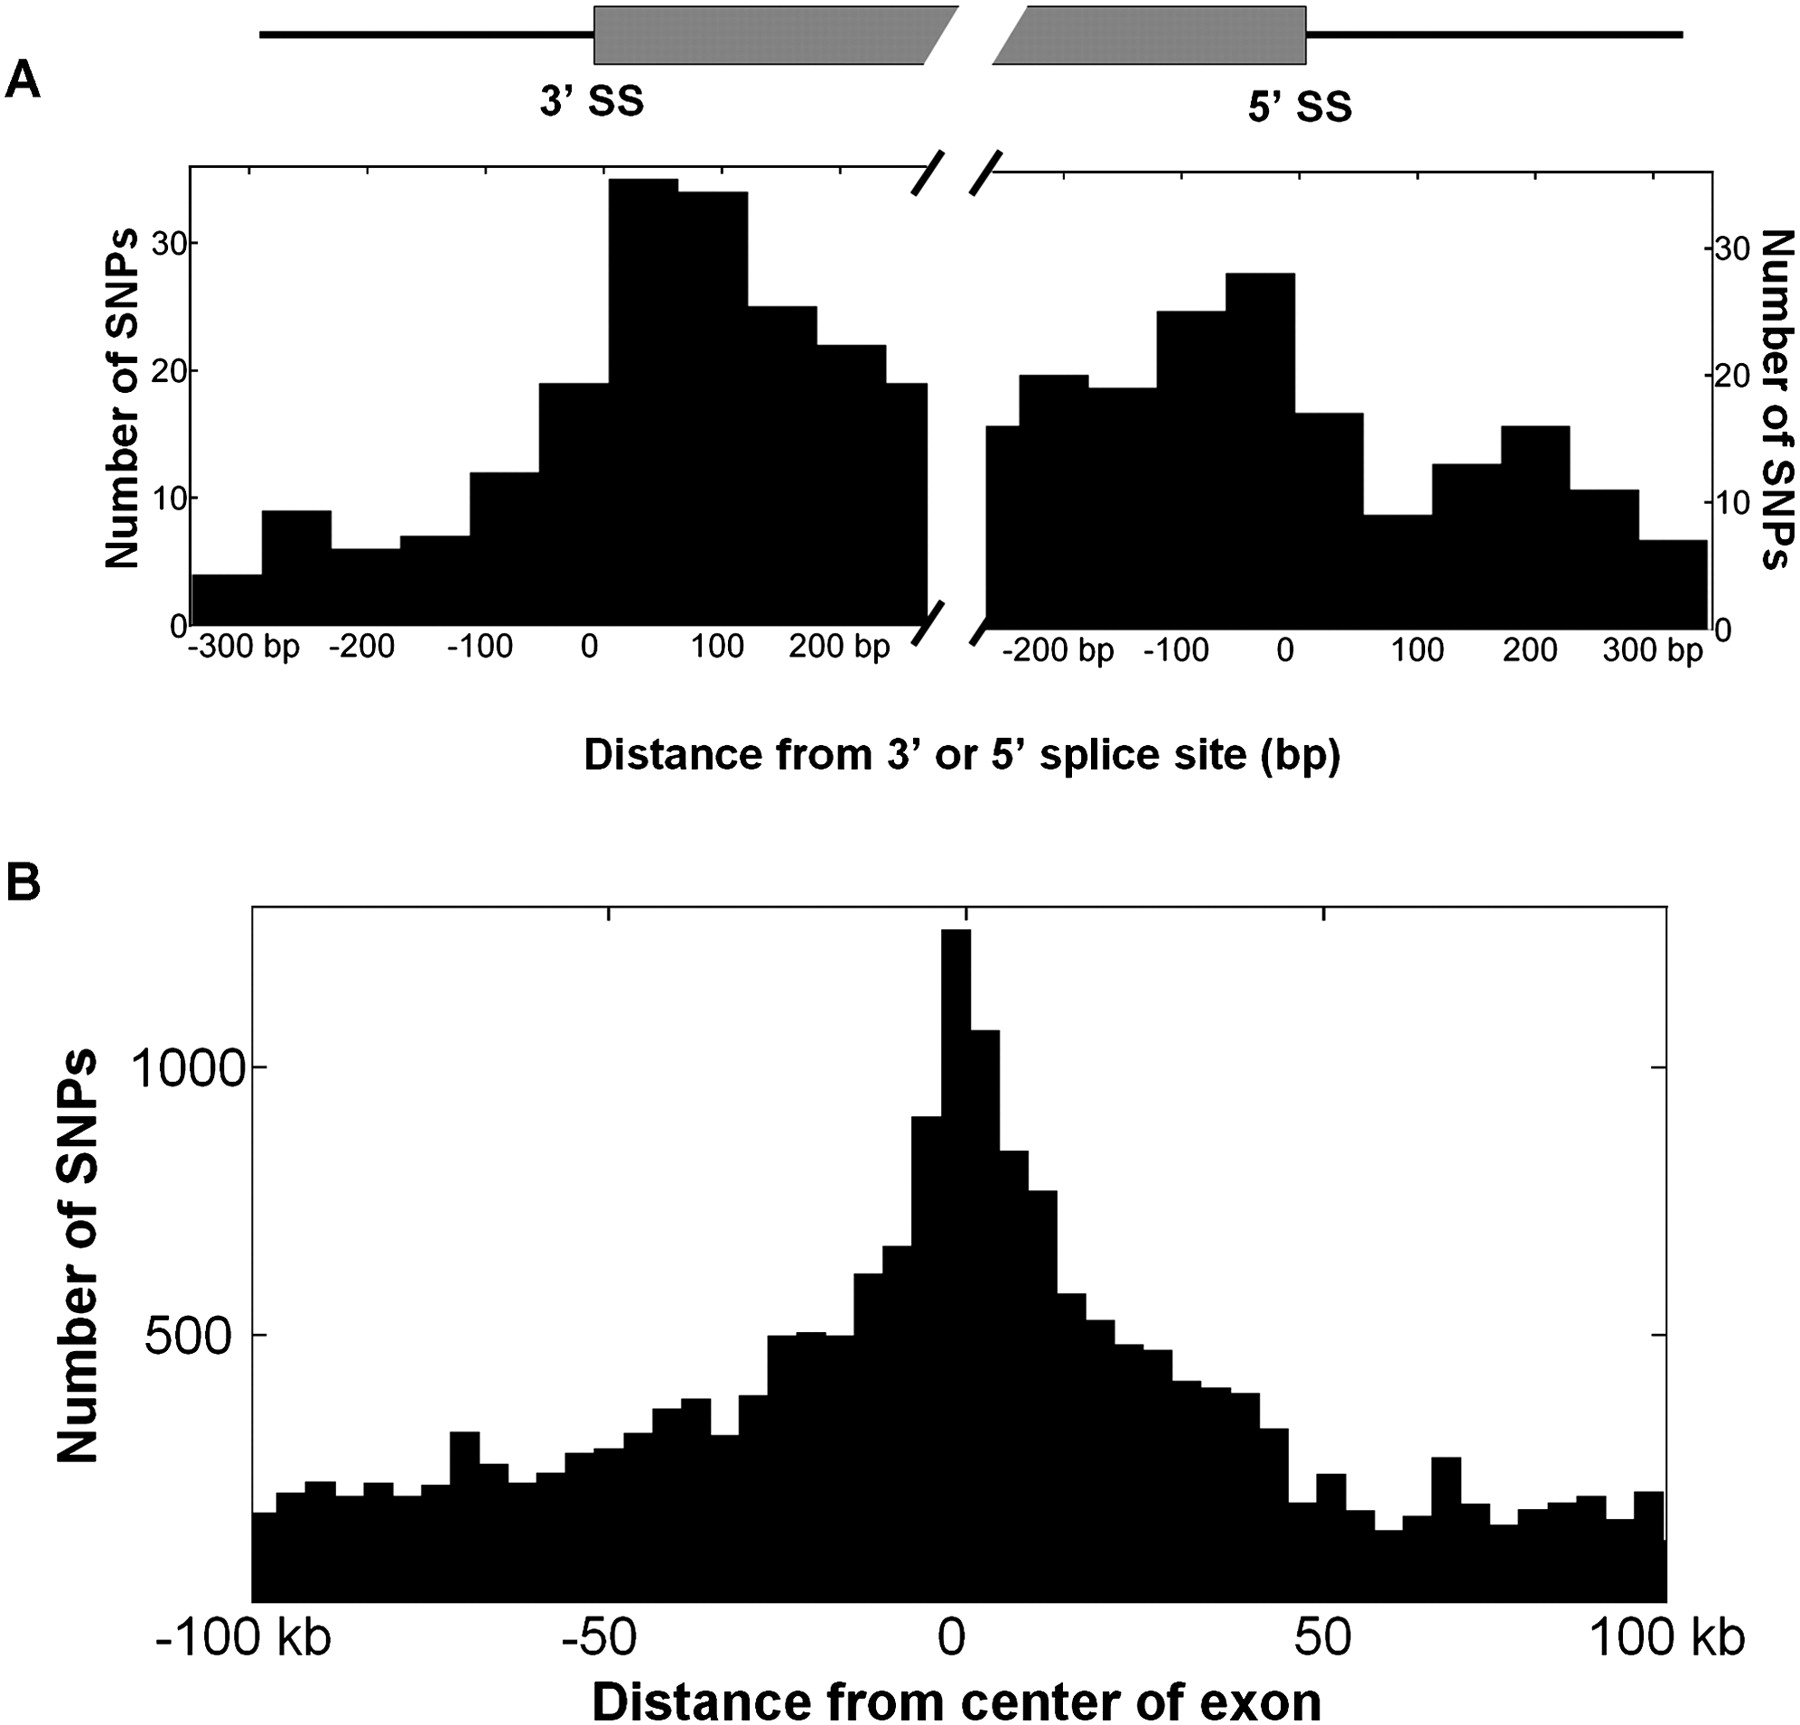
Widening the scope to examine all PTV-associated SNPs within 100 kb of each exon, it is clear that there is a strong bias for the SNPs to be located close to their associated exons (Fig. 3B, blue bars). In particular, more than a quarter (25.9%, compared to 10% expected by chance) of the SNPs are found within 10 kb of the exon's center, and more than half (54.2%, compared to 30% expected) are found within 30 kb. The fact that SNPs far away from an exon can still correlate strongly with the expression of that exon does not indicate that such distant SNPs can actually affect PTV, however, because most of these SNPs are not causal; they are simply in LD with the causal polymorphism. Whether any of the distant SNPs are, in fact, causal will be an interesting question for future research.
To test if PTV-associated SNPs may have been subject to recent positive natural selection, we compared our high-confidence SNPs to the results of two methods for detecting positive selection (known as iHS and LRH) that were recently applied to the same set of Phase II HapMap SNPs used in our analysis (Sabeti et al. 2007). In that study, 1.7% of SNPs were characterized as having undergone strong (P < 10−3) positive selection in either CEPH or YRI populations; however, 7.0% (400/5688) of the high-confidence splicing SNPs fell into these regions, a 4.1-fold enrichment. We conclude that the PTV-associated SNPs are overrepresented in regions of recent positive selection, and therefore some of the selective sweeps may have been caused by the phenotypic effects of PTV. Interestingly, tests of more ancient selective sweeps (such as high frequency derived alleles or population differentiation) (Bamshad and Wooding 2003; Sabeti et al. 2006; see Supplemental Note) do not yield significant overlap with the PTV-associated SNPs, suggesting that we are seeing the effects of only very recent positive selection.
PTV in complex diseases
The list of PTV-associated SNPs can also be used to help interpret results from genome-wide association studies (GWAS). The end result of a successful GWAS is a list of SNPs associated with a phenotype (usually a disease), but there is rarely any indication—beyond educated guesses of the authors—of either what genes may be involved or how those genes could be affected by the polymorphisms. Such functional information is crucial in order for GWAS to make any contribution to our understanding of disease etiologies. To determine how some SNPs implicated by GWAS might be influencing disease, we compared the list of high-confidence PTV-associated SNPs to disease-associated SNPs. We assembled a list of 73 SNPs reproducibly associated with a wide range of diseases in an unbiased compilation of 21 published GWAS (see Methods); in contrast to the 0.12 overlaps expected by chance, we observed 4 SNPs occurring in both lists, a 33-fold enrichment. All four of these SNPs were associated with autoimmune diseases, even though autoimmune disease SNPs comprised less than a third of the SNPs in our disease association list. The expected number of overlaps with autoimmune-associated SNPs was only 0.04, meaning that the four observed overlaps constituted a 100-fold enrichment for this disease class (P = 10−7). The four SNPs were associated with four different autoimmune diseases: Crohn's disease (CD), Type 1 diabetes (T1D), rheumatoid arthritis (RA), and ankylosing spondylitis (AS). The enrichment for autoimmune conditions was especially interesting because we were examining PTV in B-cells, a cell type intimately connected to these diseases.
Encouraged by this overlap, we extended the analysis to consider SNPs that were more weakly (P < 10−4) associated with autoimmune diseases in the largest autoimmune GWAS performed to date (Wellcome Trust Case Control Consortium 2007a). Among 206 additional disease SNPs, four were also in the set of PTV SNPs, bringing the total number of overlaps to eight (20-fold greater than expected, P = 10−8). Although the disease associations of these four additional SNPs have not been replicated, the fact that they are also found in the list of PTV SNPs indicates that they are more likely to be bona fide disease associations than other SNPs at the same disease-association significance level.
The eight disease/PTV-association overlaps are listed in Table 2. Two of these (IRF5 and OAS1), the two top hits genome-wide (Fig. 2A,B; Table 1), have already been convincingly associated with both polymorphic splicing and other autoimmune diseases (Fedetz et al. 2006; Graham et al. 2007; Kozyrev et al. 2007), so their unreplicated associations with RA and CD are quite plausible (and previous work supports the IRF5-RA association as well) (Sigurdsson et al. 2007). For the four replicated disease SNPs, we implicate four genes that are all good functional candidates: ERAP1, PTPN2, CLEC2D, and TRAF1. ERAP1 (also known as ARTS-1) is an N-terminal aminopeptidase involved in immune functions, and also our third strongest hit in the entire genome (Table 1). The same SNP is associated with both AS (Wellcome Trust Case Control Consortium 2007b) and usage of the 3′-most ERAP1 splice site (Fig. 2C; alternate forms differ in the final nine amino acids and the entire 3′-UTR; confirmed by RT-PCR) (Kwan et al. 2008). PTPN2 is a tyrosine phosphatase with two known splice variants (Fig. 2D), one of which localizes to the nucleus and the other to the endoplasmic reticulum (Ibarra-Sanchez et al. 2000). The nuclear isoform is known to dephosphorylate several important targets in T-cells, including STAT1 (ten Hoeve et al. 2002), so autoimmune disease phenotypes could certainly be influenced by the ratio of these splice forms (Todd et al. 2007). CLEC2D (also known as LLT1) is a C-type lectin involved in immune response, and the PTV/T1D-associated SNP (Todd et al. 2007; Wellcome Trust Case Control Consortium 2007a) is at the penultimate base of its second exon (Fig. 2E), which is the same exon covered by the significant probe set. Therefore, this may well be the causal SNP, leading to skipping of the second exon and loss of 37 amino acids from the protein. TRAF1 is a downstream effector of tumor necrosis factor receptors 1 and 2 (Lee and Choi 2007) and is an excellent functional candidate for RA (Plenge et al. 2007). The predicted transcript variants differ in the length of the 3′-UTR (Fig. 2F) and are supported by multiple ESTs (Boguski et al. 1993). It is not clear what functional importance the 3′-UTR may have, but a role in the translation of TRAF1 mRNA is quite possible, considering that many potential microRNA binding sites are present in the 3′-UTR (Kertesz et al. 2007). The final two overlapping SNPs (with thus far unreplicated T1D associations) (Wellcome Trust Case Control Consortium 2007a) are close to SPG7 and POLR2B, neither of which are obvious functional candidates for T1D. SPG7, an AAA protease involved in mitochondrial ribosome assembly, is known to cause hereditary spastic paraplegia when mutated (Nolden et al. 2005). The most significant probe set in this gene distinguishes between two known splice forms that differ by nine coding exons (Fig. 2G). POLR2B is a subunit of RNA Pol II, and the significant probe set detects a computationally predicted coding exon near the 3′-end of the transcript (Fig. 2H).
Eight SNPs associated with autoimmune disease and transcript variation

[i] Disease association P-values are as reported (Wellcome Trust Case Control Consortium 2007a,b; Todd et al. 2007). The PTPN2 P-value is a trend test for all three diseases listed (Wellcome Trust Case Control Consortium 2007a). Distances to splice sites are given only to the closer of the two sites for the relevant exon; negative distances indicate upstream SNPs. Fisher's combined P-values are given as −log10 values. (RA) Rheumatoid arthritis; (CD) Crohn's disease; (AS) ankylosing spondylitis; (T1D) Type I diabetes.
[ii] aIRF5 splice variants have also been associated with systemic lupus erythematosus (Graham et al. 2007; Kozyrev et al. 2007).
[iii] bOAS1 splice variants have also been associated with multiple sclerosis (Fedetz et al. 2006) and viral infectivity (Bonnevie-Nielsen et al. 2005).
Discussion
We have conducted the largest study of polymorphic transcript variation in any species to date. Our major conclusions are: Tens of thousands of human exons have heritable splice patterns in B-cells; more than 1000 of these heritable exons strongly correlate with nearby HapMap SNP genotypes; some PTV-associated SNPs may have been subject to strong positive selection in recent human history; and the list of PTV-associated SNPs is highly (100-fold) enriched for autoimmune disease-associated SNPs reported by recent GWAS, demonstrating that these SNPs most likely affect disease via alterations in splicing and polyadenylation site usage.
A recent paper by Kwan et al. (2008) used the same Affymetrix exon arrays on HapMap cell lines to investigate the genetic control of PTV. They found 757 probe sets with significant (FDR = 0.05) SNP genotype associations. Comparing their list with our high-confidence list of 461 significant probe sets, we find 74 overlaps, compared to 1.4 expected by chance (overlap with our medium-confidence list is 145 probe sets, compared to 3.3 expected). Even though this overlap is ∼50-fold more than expected, it is still far from perfect. Reasons for the imperfect overlap may include the different distance cutoffs used (Kwan et al. included SNPs within 50 kb of each exon, whereas we looked within 100 kb); the less stringent criteria for reporting an SNP–probe set correlation in the previous study (Kwan et al. did not require two nonoverlapping probes within each probe set to each show independent agreement, so their results may be more influenced by unannotated SNPs and cross-hybridization artifacts), the smaller sample size of the previous study (57 samples vs. 176 in our study), or the use of only one population (CEPH) in the previous study (Kwan et al. 2008). We were unable to compare the heritability values we calculated to results from Kwan et al. (2008) because they did not include any family trios in their set of cell lines.
Our estimate that ∼22% of probe sets show heritable variation should be considered a rough estimate, because we have only examined two human populations; additional individuals and populations may reveal more PTV. And, of course, examining additional cell types will likely reveal a great deal more PTV as well. On the other hand, much like with all other studies of gene expression genetics, we do not know exactly what portion of our heritable probe sets could be due to artifacts. For example, SNPs can disrupt array probe hybridization and lead to spurious correlations; however, our stringent requirements for observing the same signal from multiple nonoverlapping probes within a probe set make our results much less susceptible to such artifacts than previous studies of genome-wide gene expression genetics (see Methods).
While the list of more than 1000 probe sets highly correlated with HapMap SNP genotypes is large compared to what was previously known, it is small in comparison to our estimate for the number of heritable probe sets. This difference may arise for a number of reasons, such as if a large fraction of PTV is caused by (1) polymorphisms not represented by the HapMap SNPs with MAF >10%; (2) multiple polymorphisms; or (3) trans-acting polymorphisms (while we did test the last of these, our power to discover trans-acting variants was low). Examining PTV in additional extensively genotyped cell lines has the potential to address all three of these potential causes.
A previous study using the same exon arrays on two HapMap CEPH cell lines (Kwan et al. 2007) reported finding 8771 heritable probe sets at a 1% FDR. This is somewhat greater than our figure of 6536 probe sets at a 5.2% FDR. The reason for this apparent discrepancy may be that the previous study used replicate arrays and thus may have had more statistical power to find subtle differences; or it may be because we only called heritable any probe set that was similar between parents and offspring (narrow-sense heritability), whereas they considered all differences between two cell lines (broad-sense heritability). Differences between cell lines such as those due, for example, to different Epstein-Barr virus titers or other in vitro artifacts (Choy et al. 2008) not inherited from parents would thus be included in their list, but not in ours.
Our results can be compared in several ways to a recent study that measured gene expression levels in HapMap cell lines, using an array with probes targeted to the 3′-ends of transcripts (Stranger et al. 2007). First, there was a total of 608 genes whose expression levels were found to correlate with SNP genotypes in the YRI or CEPH samples, at an ∼4% FDR. This FDR is in between that of the high- and medium-confidence lists, which contain 380 and 793 genes, respectively; therefore, approximately equal numbers of genes appear to be affected by each type of polymorphism (at similar FDRs). Second, the spatial distribution is much broader for SNPs correlated with overall gene expression levels (“expression SNPs”) than for PTV-associated SNPs (Fig. 3B), consistent with the fact that gene expression can be affected by enhancers up to a megabase or more away from the gene. And third, we can ask whether expression SNPs overlap with autoimmune disease SNPs more than expected by chance. Comparing 1218 reported expression SNPs (Stranger et al. 2007) with the 24 confirmed autoimmune-associated SNPs, we find no overlaps. Expanding the list of expression SNPs to 11,904 (using the exon array data to calculate overall gene expression levels) (see Methods), we still find no overlaps. Expanding the list of disease SNPs to the list of 228 weaker associations (Wellcome Trust Case Control Consortium 2007a), we find two overlaps with our list of 11,904 expression SNPs and two with the published list of 1218 expression SNPs as well. One of these (rs6457617 associated with both RA and expression of HLA-DQA2) is found in both expression-associated SNP lists; however, the other overlapping SNP from the published expression SNP list (Stranger et al. 2007), involving SPG7 (Fig. 2G), appears to be a case where the 3′ array probe can detect only one splice variant, and thus mistakes polymorphic splicing for polymorphic expression of the entire gene (Supplemental Fig. 3). In summary, SNPs associated with overall expression levels of genes appear to have at most a weak enrichment for SNPs associated with autoimmune diseases, in contrast to the results presented above for PTV-associated SNPs (Table 2).
The great (100-fold) enrichment of disease/PTV-associated SNP overlaps above that expected by chance effectively eliminates the possibility that the SNPs could simply be in LD with two distinct causal polymorphisms (one affecting PTV, the other affecting disease), because overlaps resulting from pairs of polymorphisms in LD should not occur any more often than expected by chance. Additionally, we can rule out any chance that the PTV could occur as a downstream result of the disease, because the association between each SNP and disease is so much weaker than the association between the same SNP and PTV. Thus, our results support the only remaining causal scenario: that the PTV we see associated with disease SNPs likely contributes to the etiology of these diseases (see Supplemental Note). This hypothesis makes the testable prediction that the transcript variants we observed should be more strongly associated with the diseases than are the underlying SNPs. Our finding that all of our top three PTV associations (Table 1)—as well as several weaker hits—involve SNPs with well-established disease associations implies that our list of PTV-associated SNPs may be a rich resource for interpreting the results of many future disease association studies. Moreover, the fact that all of these PTV/disease associations involve autoimmune conditions implies that much of the PTV we have observed may be tissue specific, and therefore that catalogs of PTV from other cell types could also be quite informative for understanding diseases related to their tissues of origin.
Methods
Normalization and filtering of the exon array data
The Affymetrix human exon microarray (Clark et al. 2007) (v1.0) contains approximately 6 million probes, grouped into approximately 1.4 million probe sets (typically 1 probe set for one exon). We first identified the probes contained in RefSeq transcripts (from UCSC Genome Browser, total 25,319 transcripts). The probes overlapping SNPs in the dbSNP database (release 126, total approximately 12 million) were removed from further analysis because these SNPs can disrupt hybridization of those probes and lead to false estimation of their expression levels. Because most SNPs reported only once are likely to be either incorrect or quite rare, we also curated a second list of RefSeq probes by removing only those overlapping the so-called double-hit SNPs (total approximately 5.3 million), which are reported at least twice or have a minor allele count of at least two.
The probes in different arrays were then quantile sketch normalized (Bolstad et al. 2003). The expression levels of probe sets and genes were summarized independently using the PLIER (probe logarithmic intensity error) algorithm contained in the Affymetrix Power Tools (APT) software package. The PLIER algorithm is a model-based method for multiple array analysis that accounts for differences in probe intensity between arrays by explicitly introducing parameters describing these differences (see http://www.affymetrix.com/support/technical/technotes/plier_technote.pdf). We calculated the normalized probe set intensity (NI) by dividing the probe set intensity by the intensity of the gene it belongs to. The purpose of the NI is to remove variation caused by changes in the overall gene expression levels (Clark et al. 2007).
Analysis of heritable probe sets
To generate the blue (parent–child heritabilities) histogram in Figure 1A, we calculated the Pearson correlation between parents and children for each of approximately 171,000 probe sets passing our filters, normalized by each RefSeq mRNA in which they appear. Narrow-sense heritability is equal to twice the Pearson correlation coefficient, assuming equal variances in parents and offspring. To generate the red (randomized) histogram, we chose random pairs of individuals from the same population and plotted their heritabilities. Because we used random pairings to generate the null distribution, we expected to see a symmetric distribution with zero mean, as was observed. To adjust for gender, we used SOLAR (Almasy and Blangero 1998), which gave results similar to the correlation metric (Supplemental Fig. 1), as expected since gender does not associate with PTV in this data set (0.4% and 0.5% of probe sets associated with gender at P < 0.01 in CEPH and YRI, respectively; 1% expected by chance for both).
We estimated that 22.4% of all probe sets showed higher than expected heritability by finding the point at which the distributions in Figure 1A cross, and then calculating the number of observed probe sets minus the number of expected probe sets. While we cannot predict exactly which probe sets comprise the 22.4% (since the FDR would be high), this is the best estimate we can make of the total number of heritable probe sets in the data.
One way that parent–child correlations could be higher than expected would be if trios were preferentially hybridized together in batches (known as a “batch effect”). To ensure that this did not affect our analysis, we confirmed from the dates of array scanning in each CEL file that family members were not processed together in batches.
Searching the GO (The Gene Ontology Consortium 2000) and PIR (Wu et al. 2003) databases for enrichments was done using the DAVID online tool (Dennis Jr. et al. 2003).
Comparing PTV with genetic polymorphisms
We first calculated a Pearson correlation coefficient (r) between probe set normalized intensity and SNP genotypes for CEPH and YRI separately. The P-value for each correlation coefficient is based on the Student's t statistic t = r * sqrt[(n − 2)/(1 − r2)], where n is the number of pairs used in calculating r. The P-value is the cumulative probability for the absolute value of t under the Student's t distribution with n − 2 degrees of freedom. The P-values for CEPH (pc) and YRI (py) are then combined using Fisher's method. The combined P-value is based on the test statistic X2 = −2 [log(pc) + log(py)]. The combined Fisher P-value is the cumulative probability for X2 under a chi-square distribution with 4 degrees of freedom. Note that the populations cannot be combined for calculating the correlation itself, because this would lead to a number of spurious correlations.
We required a MAF of at least 10% for an SNP to be eligible for testing correlations with PTV. The reason for this is that at frequencies significantly <10%, the accuracy with which P-values can be calculated by our method is lower. However, we have confirmed that for MAF >10%, this effect is negligible (data not shown).
We then compiled two lists of probe set/SNP correlations. For the high-confidence list, we excluded all probes overlapping any dbSNP entry and required the combined P-value < 10−5.5; for the medium-confidence list, we excluded only double-hit dbSNPs and relaxed the cutoff to a combined P-value of 10−4.5. For the high-confidence list, we additionally excluded probe sets with any possibility of cross-hybridization (as determined by Affymetrix) and probe sets not expressed above background in at least half of the samples, and required at least two nonoverlapping probes within the probe set at r > 0.3 (P < 0.002) in at least one population. The rationale behind requiring two nonoverlapping probes to agree is that even after excluding all dbSNP entries, there are still unknown SNPs that could affect our results by disrupting the hybridization of probes; but at least two unknown SNPs would be required to affect two nonoverlapping probes. This is expected to be quite rare: We found that only 50 out of approximately 180,000 probe sets within RefSeq genes contained multiple nonoverlapping probe sets that both contained HapMap SNPs and correlated with nearby SNPs at our high-confidence thresholds. Since the Phase II HapMap contains about half of all common SNPs and dbSNP contains ∼80% (Sabeti et al. 2006), we expect to see only ([1 − 0.8]/0.5)2 * 50 = 8 false positives in our high-confidence list due to unknown SNPs. (The term is squared because two SNPs are required to disrupt nonoverlapping probes, so even though there are expected to be (1 − 0.8)/0.5 = 0.4 times as many unknown common SNPs as HapMap SNPs, there should be only ([1 − 0.8]/0.5)2 = 0.16 times as many pairs of disrupted probes.) Any bias among HapMap SNPs toward being located in exons will make this analysis conservative since it will increase the frequency of HapMap SNPs falling within probe sets. Rare SNPs do not present a problem for our analysis because they will almost never be present in more than two (a parent and child) of our 176 samples. Many probe sets contain only overlapping probes by design, so for the medium-confidence list, we relaxed the requirement of at least two nonoverlapping high correlation probes, including probe sets with all probes r > 0.4 in at least one population.
To calculate the expected number of false positives in each list, we needed to take into account the trio family structure of the data, since because of this structure, the 176 cell lines do not actually represent 176 independent samples. To account for this, we performed a permutation test in which genotypes were swapped randomly between entire trios, instead of for each individual separately (as is usually done). By swapping entire trios, we preserve the family structure and calculate accurate false positive rates. Importantly, this permutation strategy also controls for hidden biases that may be present at any step of the analysis.
Genome-wide association studies
Our list of disease-associated SNPs come from 21 GWAS found in an unbiased literature search conducted in October 2007 (Buch et al. 2007; Diabetes Genetics Initiative of Broad Institute of Harvard and MIT 2007; Easton et al. 2007; Frayling et al. 2007; Gudbjartsson et al. 2007; Gudmundsson et al. 2007; Hunter et al. 2007; McPherson et al. 2007; Moffatt et al. 2007; Plenge et al. 2007; Scott et al. 2007; Sladek et al. 2007; Steinthorsdottir et al. 2007; Todd et al. 2007; Tomlinson et al. 2007; van Heel et al. 2007; Wellcome Trust Case Control Consortium 2007a,b; Winkelmann et al. 2007; Zanke et al. 2007; Zeggini et al. 2007). Any SNPs not included in HapMap Phase II or refuted in subsequent studies were excluded.
Incidentally, the ERAP1 association was found in a scan of 14,500 missense SNPs (Wellcome Trust Case Control Consortium 2007b). This subset of SNPs was examined under the expectation that they would be enriched for functional variants that exert their phenotypic influence by altering single amino acids. However, we believe that in the case of ERAP1, the causal polymorphism is more likely to act through altering usage of the 3′-most splice site because this introduces what is likely to be a more substantial change (deleting seven amino acids and altering two more, as well as changing the entire 3′-UTR) than a single amino acid alteration. Of course, this is not mutually exclusive with a mechanism of action that also includes effects of a single amino acid change resulting from a missense SNP. More detailed analysis of this region will be required to distinguish between these possibilities.
To calculate the expected overlap between the PTV-associated SNPs and disease-associated SNPs, we tested the null hypothesis that these lists would overlap no more than two randomly generated lists of HapMap SNPs of the same size. This null hypothesis is appropriate because the criteria used in deciding which SNPs are eligible for being PTV-associated or being disease-associated are independent. Therefore the expected overlap between, for example, 46 disease SNPs and 5688 PTV SNPs, given approximately 3.1 million HapMap SNPs, is 46 * 5688/3.1e6 = 0.08.
Acknowledgments
We thank D. Altshuler, C. Burge, D. Chiang, C. Cotsapas, M. Daly, R. Graham, R. Green, J. Hirschhorn, E. Lander, S. McCarroll, R. Plenge, S. Raychaudhuri, P. Sabeti, E. Woo, and R. Yelensky for helpful discussions, advice, and sharing unpublished data.
References
- ↵L. Almasy,J. Blangero,(1998) Multipoint quantitative trait linkage analysis in general pedigrees. Am. J. Hum. Genet. 62:1198–1211.
- ↵M. Bamshad,S.P. Wooding,(2003) Signatures of natural selection in the human genome. Nat. Rev. Genet. 4:99–111.
- ↵D. Baralle,M. Baralle,(2005) Splicing in action: Assessing disease causing sequence changes. J. Med. Genet. 42:737–748.
- ↵M.S. Boguski,T.M. Lowe,C.M. Tolstoshev,(1993) dbEST–database for “expressed sequence tags.”. Nat. Genet. 4:332–333.
- ↵B.M. Bolstad,R.A. Irizarry,M. Astrand,T.P. Speed,(2003) A comparison of normalization methods for high density oligonucleotide array data based on variance and bias. Bioinformatics 19:185–193.
- ↵V. Bonnevie-Nielsen,L.L. Field,S. Lu,D.J. Zheng,M. Li,P.M. Martensen,T.B. Nielsen,H. Beck-Nielsen,Y.L. Lau,F. Pociot,(2005) Variation in antiviral 2′,5′-oligoadenylate synthetase (2′5′AS) enzyme activity is controlled by a single-nucleotide polymorphism at a splice-acceptor site in the OAS1 gene. Am. J. Hum. Genet. 76:623–633.
- ↵S. Buch,C. Schafmayer,H. Völzke,C. Becker,A. Franke,H. von Eller-Eberstein,C. Kluck,I. Bässmann,M. Brosch,F. Lammert,(2007) A genome-wide association scan identifies the hepatic cholesterol transporter ABCG8 as a susceptibility factor for human gallstone disease. Nat. Genet. 39:995–999.
- ↵E. Choy,R. Yelensky,S. Bonakdar,R.M. Plenge,R. Saxena,P.L. De Jager,S.Y. Shaw,C.S. Wolfish,J.M. Slavik,C. Cotsapas,(2008) Genetic analysis of human traits in vitro: Drug response and gene expression in lymphoblastoid cell lines. PLoS Genet. 4:e1000287, 10.1371/journal.pgen.1000287.
- ↵T.A. Clark,A.C. Schweitzer,T.X. Chen,M.K. Staples,G. Lu,H. Wang,A. Williams,J.E. Blume,(2007) Discovery of tissue-specific exons using comprehensive human exon microarrays. Genome Biol. 8:R64, 10.1186/gb-2007-8-4-r64.
- ↵G. Dennis JrB.T. Sherman,D.A. Hosack,J. Yang,W. Gao,H.C. Lane,R.A. Lempicki,(2003) DAVID: Database for annotation, visualization, and integrated discovery. Genome Biol. 4:R60, 10.1186/gb-2003-4-9-r60.
- ↵Diabetes Genetics Initiative of Broad Institute of Harvard and MIT, Lund University, and Novartis Institutes of BioMedical ResearchR. Saxena,B.F. Voight,V. Lyssenko,N.P. Burtt,P.I. de Bakker,H. Chen,J.J. Roix,S. Kathiresan,J.N. Hirschhorn,M.J. Daly,(2007) Genome-wide association analysis identifies loci for type 2 diabetes and triglyceride levels. Science 316:1331–1336.
- ↵D.F. Easton,K.A. Pooley,A.M. Dunning,P.D. Pharoah,D. Thompson,D.G. Ballinger,J.P. Struewing,J. Morrison,H. Field,R. Luben,(2007) Genome-wide association study identifies novel breast cancer susceptibility loci. Nature 447:1087–1093.
- ↵W.G. Fairbrother,D. Holste,C.B. Burge,P.A. Sharp,(2004) Single nucleotide polymorphism-based validation of exonic splicing enhancers. PLoS Biol. 2:e268, 10.1371/journal.pbio.0020268.
- ↵M. Fedetz,F. Matesanz,A. Caro-Maldonado,O. Fernandez,J.A. Tamayo,M. Guerrero,C. Delgado,J.A. López-Guerrero,A. Alcina,(2006) OAS1 gene haplotype confers susceptibility to multiple sclerosis. Tissue Antigens 68:446–449.
- ↵T.M. Frayling,N.J. Timpson,M.N. Weedon,E. Zeggini,R.M. Freathy,C.M. Lindgren,J.R. Perry,K.S. Elliott,H. Lango,N.W. Rayner,(2007) A common variant in the FTO gene is associated with body mass index and predisposes to childhood and adult obesity. Science 316:889–894.
- ↵The Gene Ontology Consortium (2000) Gene ontology: Tool for the unification of biology. Nat. Genet. 25:25–29.
- ↵R.R. Graham,C. Kyogoku,S. Sigurdsson,I.A. Vlasova,L.R. Davies,E.C. Baechler,R.M. Plenge,T. Koeuth,W.A. Ortmann,G. Hom,(2007) Three functional variants of IFN regulatory factor 5 (IRF5) define risk and protective haplotypes for human lupus. Proc. Natl. Acad. Sci. 104:6758–6763.
- ↵D.F. Gudbjartsson,D.O. Arnar,A. Helgadottir,S. Gretarsdottir,H. Holm,A. Sigurdsson,A. Jonasdottir,A. Baker,G. Thorleifsson,K. Kristjansson,(2007) Variants conferring risk of atrial fibrillation on chromosome 4q25. Nature 448:353–357.
- ↵J. Gudmundsson,P. Sulem,V. Steinthorsdottir,J.T. Bergthorsson,G. Thorleifsson,A. Manolescu,T. Rafnar,D. Gudbjartsson,B.A. Agnarsson,A. Baker,(2007) Two variants on chromosome 17 confer prostate cancer risk, and the one in TCF2 protects against type 2 diabetes. Nat. Genet. 39:977–983.
- ↵R.S. Huang,S. Duan,W.K. Bleibel,E.O. Kistner,W. Zhang,T.A. Clark,T.X. Chen,A.C. Schweitzer,J.E. Blume,N.J. Cox,(2007) A genome-wide approach to identify genetic variants that contribute to etoposide-induced cytotoxicity. Proc. Natl. Acad. Sci. 104:9758–9763.
- ↵D.J. Hunter,P. Kraft,K.B. Jacobs,D.G. Cox,M. Yeager,S.E. Hankinson,S. Wacholder,Z. Wang,R. Welch,A. Hutchinson,(2007) A genome-wide association study identifies alleles in FGFR2 associated with risk of sporadic postmenopausal breast cancer. Nat. Genet. 39:870–874.
- ↵M.J. Ibarra-Sánchez,P.D. Simoncic,F.R. Nestel,P. Duplay,W.S. Lapp,M.L. Tremblay,(2000) The T-cell protein tyrosine phosphatase. Semin. Immunol. 12:379–386.
- ↵The International HapMap Consortium (2007) A second generation human haplotype map of over 3.1 million SNPs. Nature 449:851–861.
- ↵M. Kertesz,N. Iovino,U. Unnerstall,U. Gual,E. Segal,(2007) The role of site accessibility in microRNA target recognition. Nat. Genet. 39:1278–1284.
- ↵S.V. Kozyrev,S. Lewén,P.M. Reddy,B. Pons-Estel,Argentine Collaborative GroupT. Witte,German Collaborative GroupP. Junker,H. Laustrup,C. Gutiérrez,(2007) Structural insertion/deletion variation in IRF5 is associated with a risk haplotype and defines the precise IRF5 isoforms expressed in systemic lupus erythematosus. Arthritis Rheum. 56:1234–1241.
- ↵M. Krawczak,J. Reiss,D.N. Cooper,(1992) The mutational spectrum of single basepair substitutions in mRNA splice junctions of human genes: Causes and consequences. Hum. Genet. 90:41–54.
- ↵T. Kwan,D. Benovoy,C. Dias,S. Gurd,D. Serre,H. Zuzan,T.A. Clark,A. Schweitzer,M.K. Staples,H. Wang,(2007) Heritability of alternative splicing in the human genome. Genome Res. 17:1210–1218.
- ↵T Kwan,D. Benovoy,C. Dias,S. Gurd,C. Provencher,P. Beaulieu,T.J. Hudson,R. Sladek,J. Majewski,(2008) Genome-wide analysis of transcript isoform variation in humans. Nat. Genet. 40:225–231.
- ↵A.N. Ladd,T.A Cooper,(2002) Finding signals that regulate alternative splicing in the post-genomic era. Genome Biol. 3:reviews0008, 10.1186/gb-2002-3-11-reviews0008.
- ↵T. Laitinen,A. Polvi,P. Rydman,J. Vendelin,V. Pulkkinen,P. Salmikangas,S. Mäkelä,M. Rehn,A. Pirskanen,A. Rautanen,(2004) Characterization of a common susceptibility locus for asthma-related traits. Science 304:300–304.
- ↵S.Y. Lee,Y. Choi,(2007) TRAF1 and its biological functions. Adv. Exp. Med. Biol. 597:25–31.
- ↵K.W. Lynch,A.A. Weiss,(2001) CD45 polymorphism associated with multiple sclerosis disrupts an exonic splicing silencer. J. Biol. Chem. 276:24341–24347.
- ↵R. McPherson,A. Pertsemlidis,N. Kavaslar,A. Stewart,R. Roberts,D.R. Cox,D.A. Hinds,L.A. Pennacchio,A. Tybjaerg-Hansen,A.R. Folsom,(2007) A common allele on chromosome 9 associated with coronary heart disease. Science 316:1488–1491.
- ↵M.F. Moffatt,M. Kabesch,L. Liang,A.L. Dixon,D. Strachan,S. Heath,M. Depner,A. von Berg,A. Bufe,E. Rietschel,(2007) Genetic variants regulating ORMDL3 expression contribute to the risk of childhood asthma. Nature 448:470–473.
- ↵M. Nolden,S. Ehses,M. Koppen,A. Bernacchia,E.I. Rugarli,T. Langer,(2005) The m-AAA protease defective in hereditary spastic paraplegia controls ribosome assembly in mitochondria. Cell 123:277–289.
- ↵F. Pagani,F.E. Baralle,(2004) Genomic variants in exons and introns: Identifying the splicing spoilers. Nat. Rev. Genet. 5:389–396.
- ↵R.M. Plenge,M. Seielstad,L. Padyukov,A.T. Lee,E.F. Remmers,B. Ding,A. Liew,H. Khalili,A. Chandrasekaran,L.R. Davies,(2007) TRAF1-C5 as a risk locus for rheumatoid arthritis—a genome-wide study. N. Engl. J. Med. 357:1199–1209.
- ↵P.C. Sabeti,S.F. Schaffner,B. Fry,J. Lohmueller,P. Varilly,O. Shamovsky,A. Palma,T.S. Mikkelsen,D. Altshuler,E.S. Lander,(2006) Positive natural selection in the human lineage. Science 312:1614–1620.
- ↵P.C. Sabeti,P. Varilly,B. Fry,J. Lohmueller,E. Hostetter,C. Cotsapas,X. Xie,E.H. Byrne,S.A. McCarroll,R. Gaudet,(2007) Genome-wide detection and characterization of positive selection in human populations. Nature 449:913–918.
- ↵L.J. Scott,K.L. Mohlke,L.L. Bonnycastle,C.J. Willer,Y. Li,W.L. Duren,M.R. Erdos,H.M. Stringham,P.S. Chines,A.U. Jackson,(2007) A genome-wide association study of type 2 diabetes in Finns detects multiple susceptibility variants. Science 316:1341–1345.
- ↵S. Sigurdsson,L. Padyukov,F.A. Kurreeman,U. Liljedahl,A.C. Wiman,L. Alfredsson,R. Toes,J. Rönnelid,L. Klareskog,T.W. Huizinga,(2007) Association of a haplotype in the promoter region of the interferon regulatory factor 5 gene with rheumatoid arthritis. Arthritis Rheum. 56:2202–2210.
- ↵R. Sladek,G. Rocheleau,J. Rung,C. Dina,L. Shen,D. Serre,P. Boutin,D. Vincent,A. Belisle,S. Hadjadj,(2007) A genome-wide association study identifies novel risk loci for type 2 diabetes. Nature 445:881–885.
- ↵V. Steinthorsdottir,G. Thorleifsson,I. Reynisdottir,R. Benediktsson,T. Jonsdottir,G.B. Walters,U. Styrkarsdottir,S. Gretarsdottir,V. Emilsson,S. Ghosh,(2007) A variant in CDKAL1 influences insulin response and risk of type 2 diabetes. Nat. Genet. 39:770–775.
- ↵B.E. Stranger,M.S. Forrest,M. Dunning,C.E. Ingle,C. Beazley,N. Thorne,R. Redon,C.P. Bird,A. de Grassi,C. Lee,(2007) Relative impact of nucleotide and copy number variation on gene expression phenotypes. Science 315:848–853.
- ↵J. ten Hoeve,M. de Jesus Ibarra-Sanchez,Y. Fu,W. Zhu,M. Tremblay,M. David,K. Shuai,(2002) Identification of a nuclear Stat1 protein tyrosine phosphatase. Mol. Cell. Biol. 22:5662–5668.
- ↵J.A. Todd,N.M. Walker,J.D. Cooper,D.J. Smyth,K. Downes,V. Plagnol,R. Bailey,S. Nejentsev,S.F. Field,F. Payne,(2007) Robust associations of four new chromosome regions from genome-wide analyses of type 1 diabetes. Nat. Genet. 39:857–864.
- ↵I. Tomlinson,E. Webb,L. Carvajal-Carmona,P. Broderick,Z. Kemp,S. Spain,S. Penegar,I. Chandler,M. Gorman,W. Wood,(2007) A genome-wide association scan of tag SNPs identifies a susceptibility variant for colorectal cancer at 8q24.21. Nat. Genet. 39:984–988.
- ↵H. Ueda,J.M. Howson,L. Esposito,J. Heward,H. Snook,G. Chamberlain,D.B. Rainbow,K.M. Hunter,A.N. Smith,G. Di Genova,(2003) Association of the T-cell regulatory gene CTLA4 with susceptibility to autoimmune disease. Nature 423:506–511.
- ↵D.A. van Heel,L. Franke,K.A. Hunt,R. Gwilliam,A. Zhernakova,M. Inouye,M.C. Wapenaar,M.C. Barnardo,G. Bethel,G.K. Holmes,(2007) A genome-wide association study for celiac disease identifies risk variants in the region harboring IL2 and IL21. Nat. Genet. 39:827–829.
- ↵Wellcome Trust Case Control Consortium (2007a) Genome-wide association study of 14,000 cases of seven common diseases and 3000 shared controls. Nature 447:661–678.
- ↵Wellcome Trust Case Control Consortium (2007b) Association scan of 14,500 nonsynonymous SNPs in four diseases identifies autoimmunity variants. Nat. Genet. 39:1329–1337.
- ↵J. Winkelmann,B. Schormair,P. Lichtner,S. Ripke,L. Xiong,S. Jalilzadeh,S. Fulda,B. Pütz,G. Eckstein,S. Hauk,(2007) Genome-wide association study of restless legs syndrome identifies common variants in three genomic regions. Nat. Genet. 39:1000–1006.
- ↵C.H. Wu,L.S. Yeh,H. Huang,L. Arminski,J. Castro-Alvear,Y. Chen,Z. Hu,P. Kourtesis,R.S. Ledley,B.E. Suzek,(2003) The Protein Information Resource. Nucleic Acids Res. 31:345–347.
- ↵B.W. Zanke,C.M. Greenwood,J. Rangrej,R. Kustra,A. Tenesa,S.M. Farrington,J. Prendergast,S. Olschwang,T. Chiang,E. Crowdy,(2007) Genome-wide association scan identifies a colorectal cancer susceptibility locus on chromosome 8q24. Nat. Genet. 39:989–994.
- ↵E. Zeggini,M.N. Weedon,C.M. Lindgren,T.M. Frayling,K.S. Elliott,H. Lango,N.J. Timpson,J.R. Perry,N.W. Rayner,R.M. Freathy,(2007) Replication of genome-wide association signals in UK samples reveals risk loci for type 2 diabetes. Science 316:1336–1341.
Notes
[5] [Supplemental material is available online at www.genome.org.]
[6] Article published online before print. Article and publication date are at http://www.genome.org/cgi/doi/10.1101/gr.083477.108.