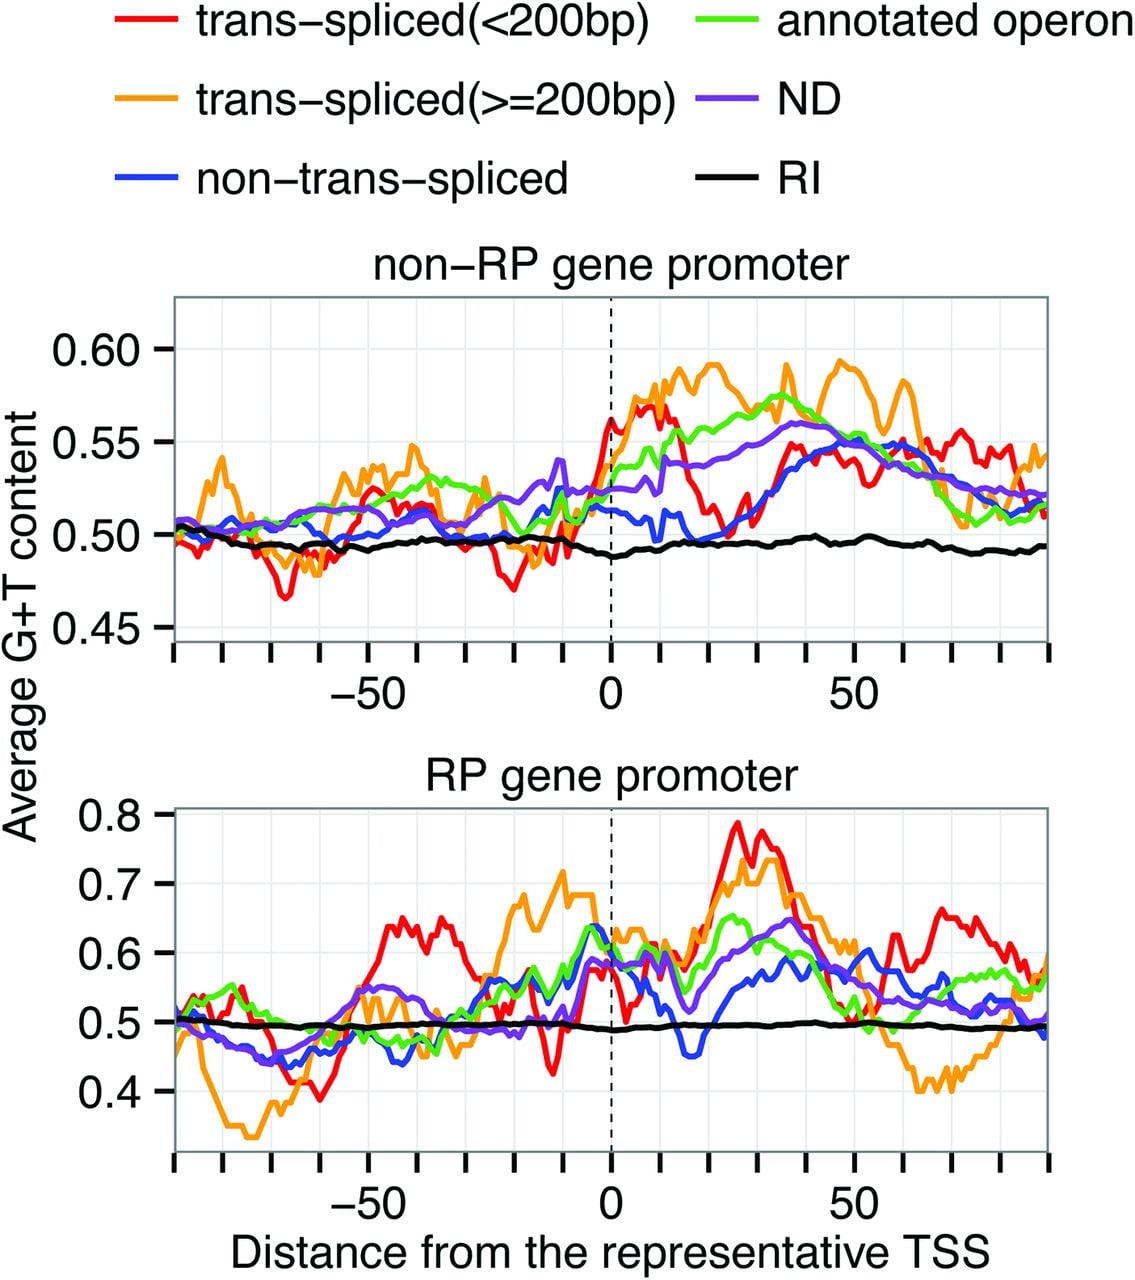
Figure 6.
Distribution of G+T content. Average G+T content was calculated using a 20-bp sliding window in each promoter class. The class of predicted operon gene promoters was not shown because the number of them was very small. The number in the parentheses represents the outron length of trans-spliced genes. (RI) Random intergenic regions.