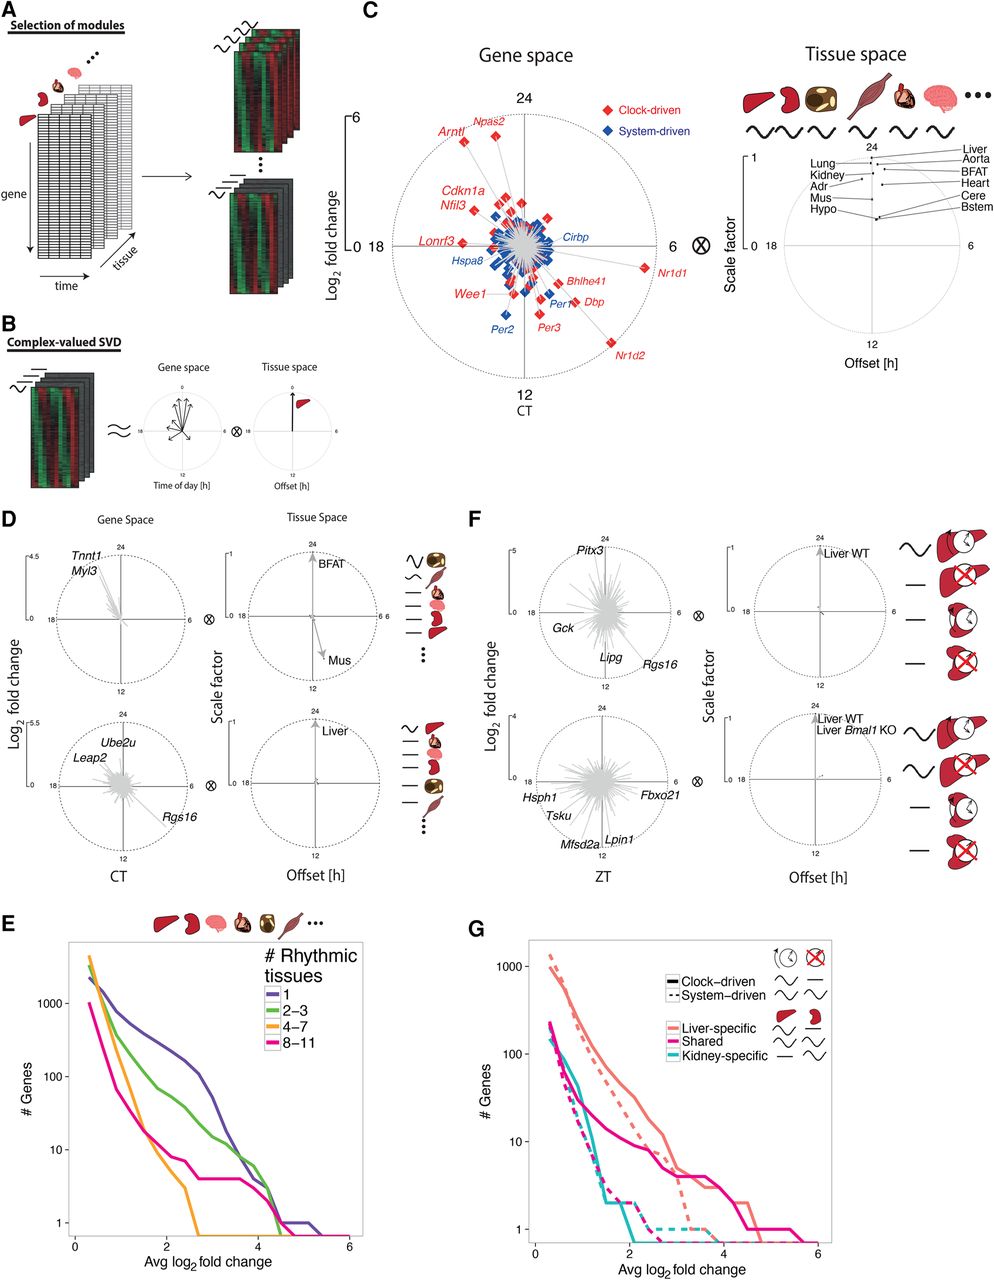
Combinatorics of rhythmic transcript expression across tissues and genotypes. (A) Schema for the model selection (MS) algorithm to identify rhythmic gene expression modules across tissues. Temporal transcriptomes of different tissues represented as a three-dimensional array (left). Gene modules are probabilistically assigned among different combinations of 24-h rhythms across tissues (e.g., tissue-specific or tissue-wide rhythms schematically shown on right). (B) Gene modules are summarized by the first component of complex-valued singular value decomposition (SVD) to highlight phase (peak time shown as the clockwise angle) and amplitude (log2 fold change shown as the radial distance) relationships between genes (gene space) and between tissues (tissue space). SVD representation is scaled such that the genes show log2 fold changes, while tissue vectors are scaled such that the highest amplitude tissue has length of 1 and a phase offset of 0 h. (C–E) MS applied to 11 WT tissues. (C) SVD representation of tissue-wide mRNA rhythms from the 11 tissues. Genes are labeled as system-driven (blue) or clock-driven (red) according to the comparison of the corresponding temporal profiles in Bmal1 KO and WT littermates. (D) Examples of anti-phasic rhythms (brown fat and muscle, n = 20, first SVD component explains 81% of variance), and tissue-specific rhythms (liver, n = 846, first SVD component explains 59% of variance). Representative genes with large amplitudes are labeled. (E) Number of transcripts showing rhythms (P-value < 0.01, harmonic regression) in different numbers of tissues, in function of increasing peak to trough amplitudes on the x-axis. x-axis: average log2 fold change calculated from the identified rhythmic tissues. (F,G) MS applied to Bmal1 KO and WT littermates in liver and kidney. (F) SVD representation of clock- (top, n = 991, 83% of variance) and system-driven (bottom, n = 1395, 84% of variance) liver-specific rhythms. (G) Number of transcripts showing clock- (solid) or system-driven (dotted) rhythms (P-value < 0.01, harmonic regression) in liver (red), kidney (blue), or both (magenta).