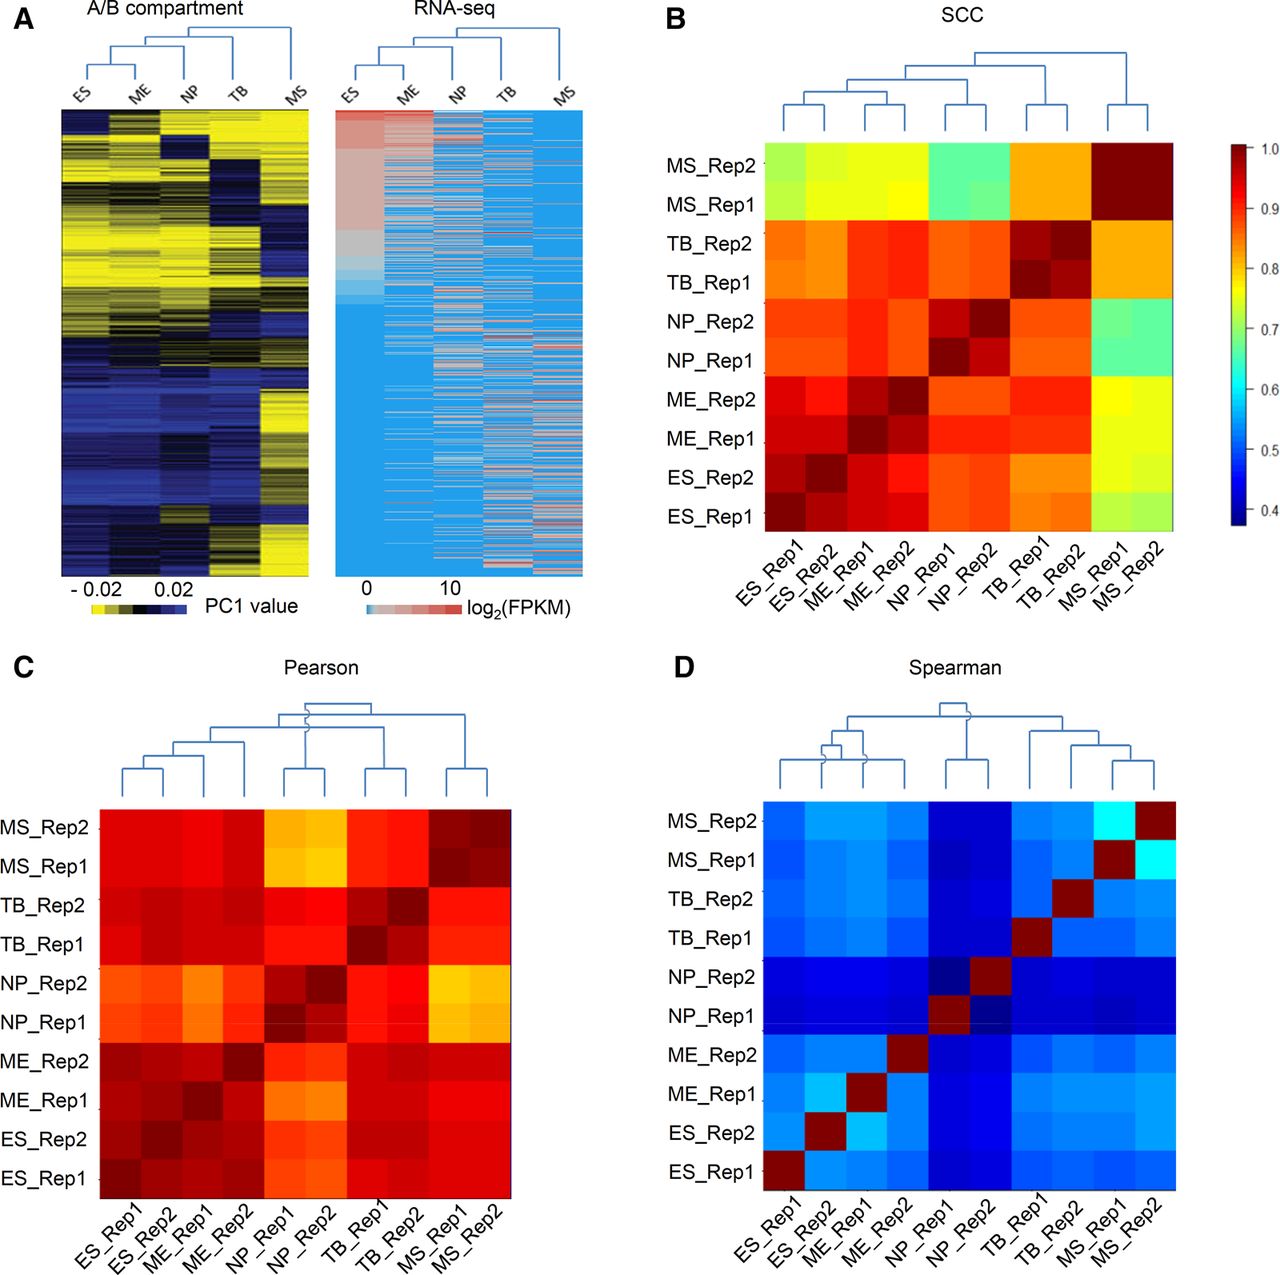
Estimating interrelationship between the 10 samples in the human H1 ESC lineage. (A) The heatmap and lineage relationship between the ES cell and its five derived cells based on A/B compartments in Hi-C data (Dixon et al. 2015) and RNA-seq data in (Xie et al. 2013). (B–D) Estimated interrelationship based on the pairwise similarity score calculated using SCC (B), Pearson correlation (C), and Spearman correlation (D). Heatmaps show the similarity scores. Dendrograms resulted from a hierarchical clustering analysis based on the similarity scores. For easy visualization, the cell lines in the heatmaps are ordered according to their known distances to ES cells in A. A decreasing trend of scores is expected from left to right (from bottom to top, respectively) if the estimated interrelationship agrees with the known lineage.