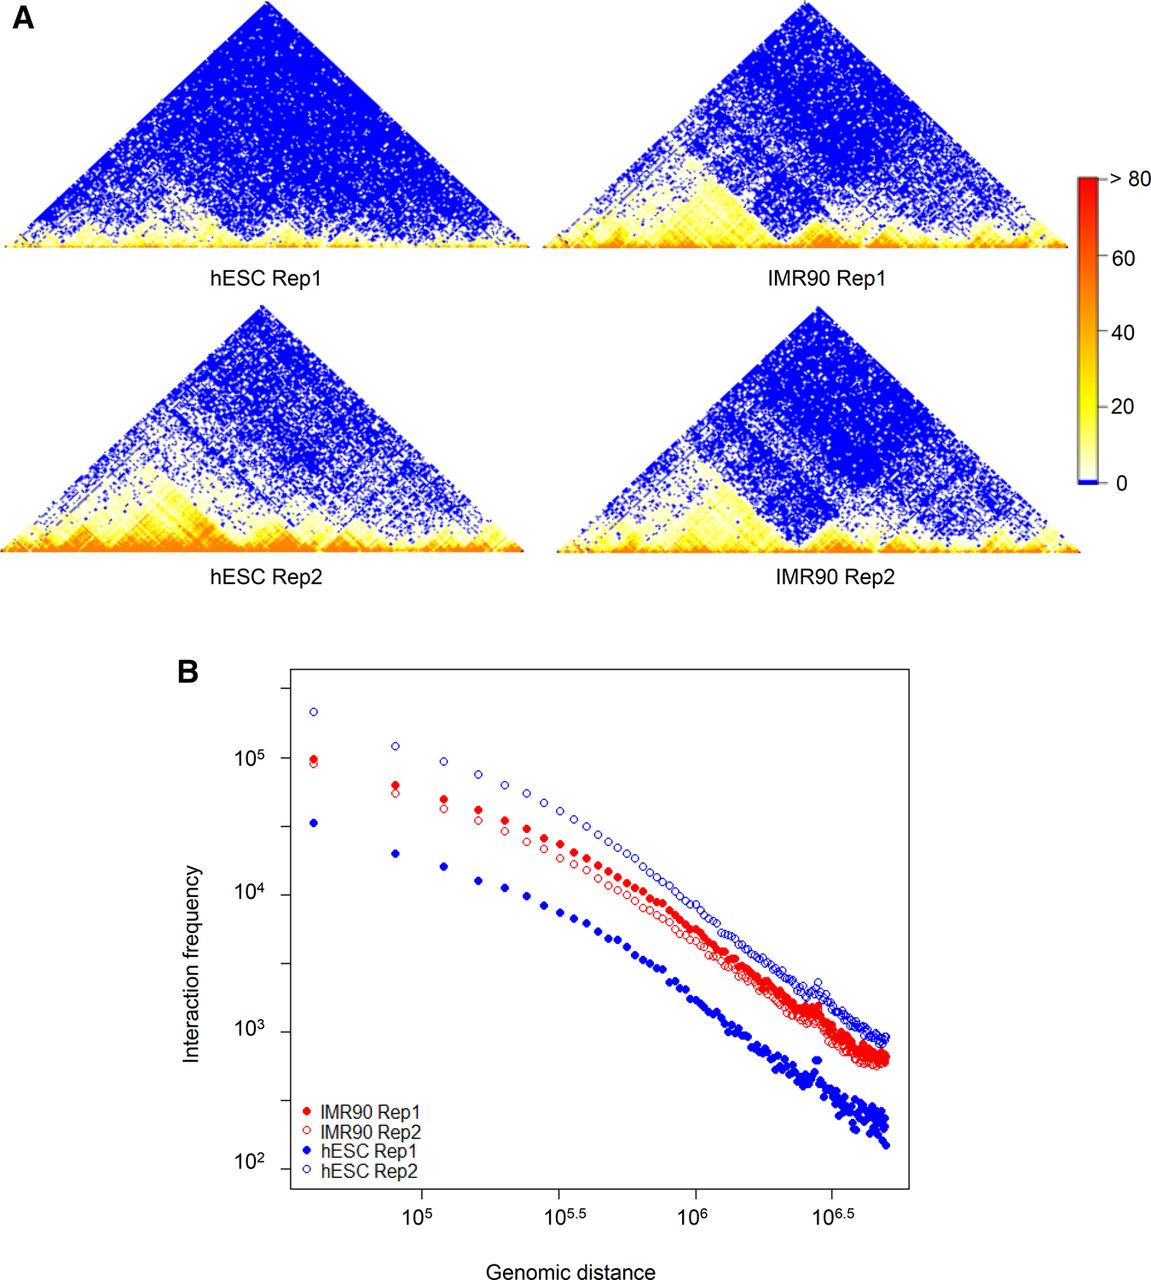
Figure 1.
An illustration example. (A) Hi-C contact maps of the biological replicates of hESC and IMR90. (B) Relationship between genomic distance and the average contact frequency for the samples in A. Data are from Chromosome 22: 32000000–40000000.