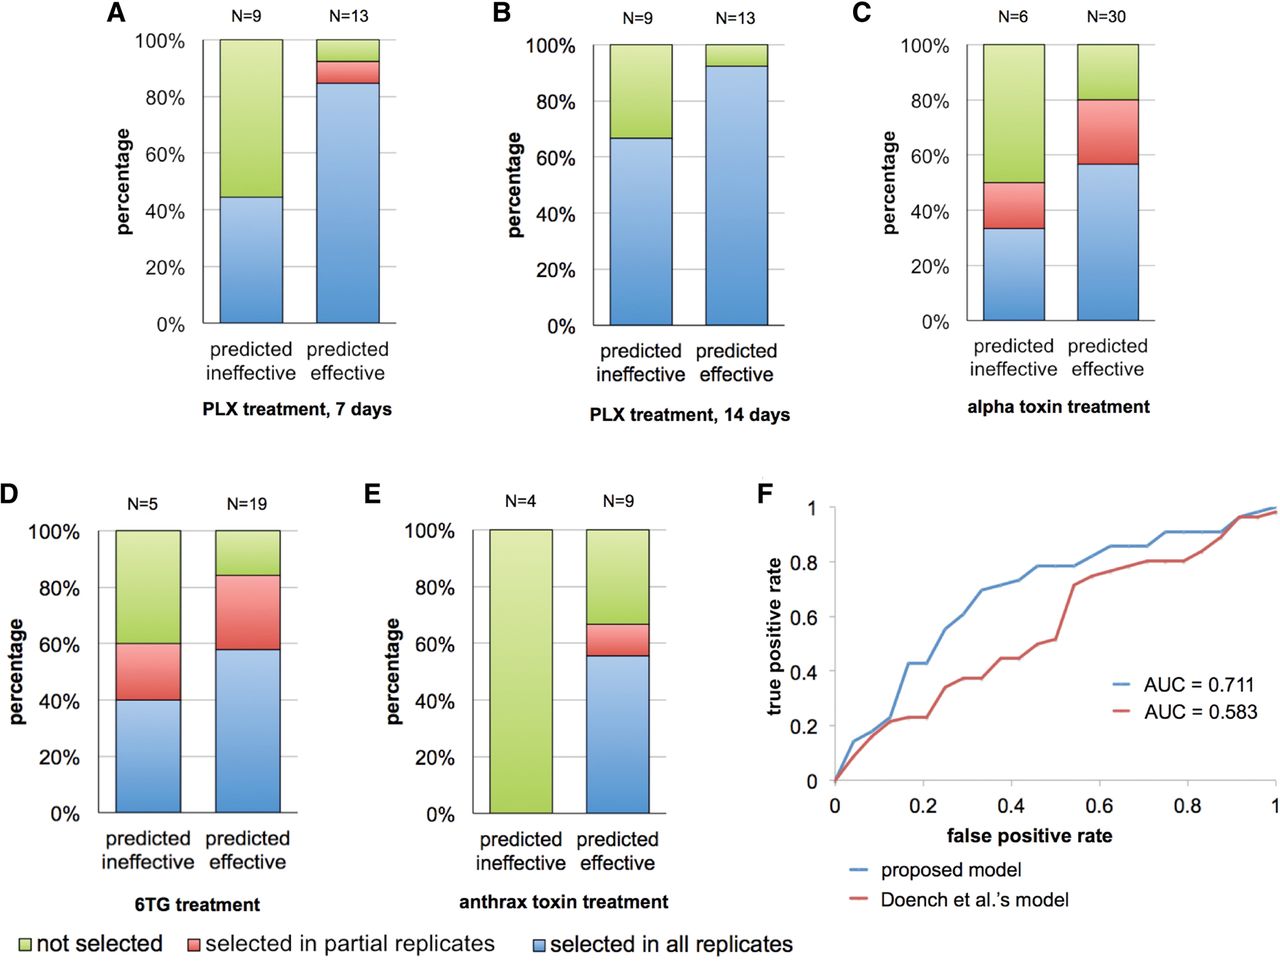
Figure 5.
Assessment of the sequence models in predicting sgRNA efficiency in positive selection experiments. (A–E) Bar charts showing the capability of selection and the experimental reproducibility for predicted efficient and inefficient sgRNAs. The tested sgRNAs target the genes known to be involved in the resistance to different drug treatment or external stimulus. (F) ROC curves comparing the performance of the proposed model and the Doench et al. (2014) model in predicting sgRNA efficiency in positive selection experiments. In the evaluation, the positive test set consists of the sgRNAs selected in all replicates in B–E; and the negative test set consists of those not selected in B–E.