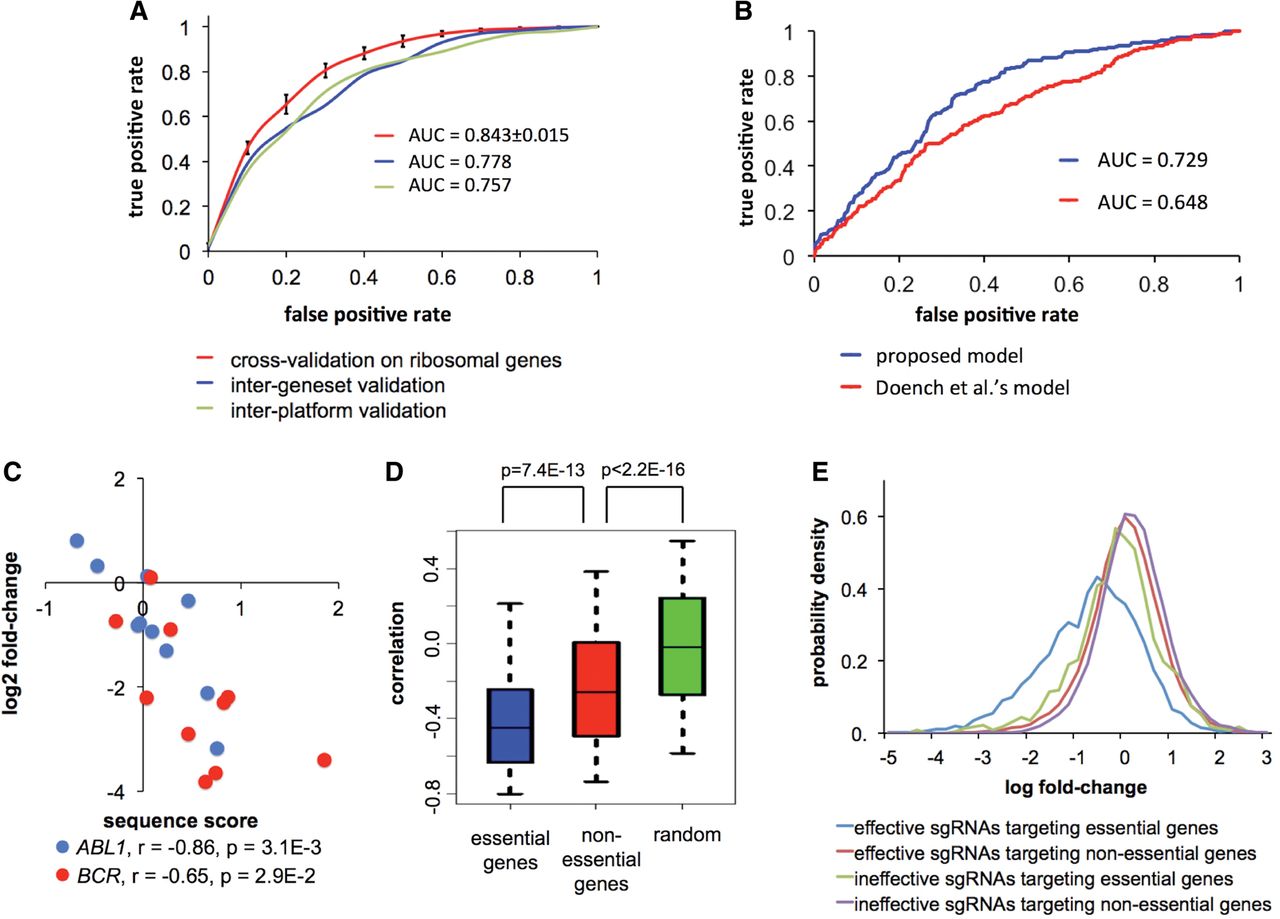
Predicting sgRNA efficiency from sequence context in CRISPR/Cas9 knockout screens. (A) ROC curves showing the predictive power of the proposed model. (Red) Threefold cross-validation on the sgRNAs targeting ribosomal genes in Wang data; (blue) trained on ribosomal genes, and tested on nonribosomal genes in Wang data; (green) trained on Wang data, and tested on Koike-Yusa data. The black error bars on the red curve represent standard deviations computed from 10 iterations of random sampling in cross-validation. (B) ROC curves comparing the performance of the proposed model and the Doench et al. (2014) model in predicting sgRNA efficiency in Shalem data. (C) Scatter plot showing the correlation between the predicted sequence score and the relative sgRNA abundance for ABL1 and BCR in KBM-7 cells. The P-values were computed based on the Pearson correlation test. (D) Box plot showing the distributions of correlations between sequence scores and relative sgRNA abundances for essential and nonessential genes in KBM-7. The distribution of random background was computed by permuting the sequence scores within each gene in the data set. (E) Distributions of relative sgRNA abundances in KBM-7 cells, where the sgRNAs were categorized based on the predicted efficiency and the essentiality of their targeted genes.