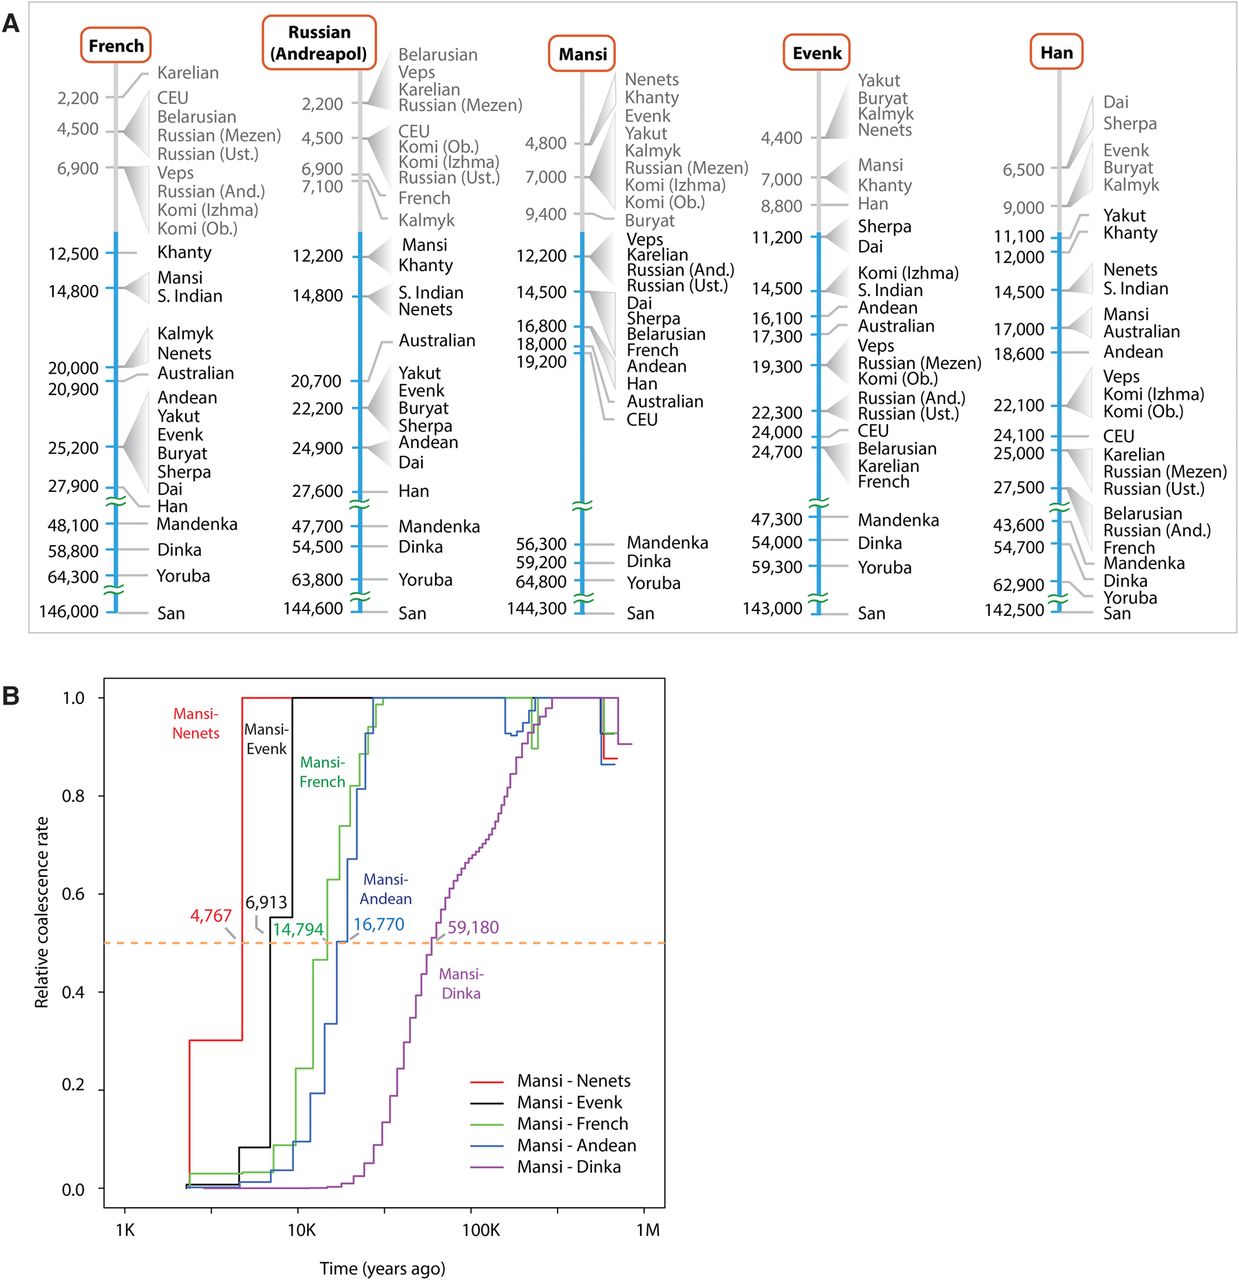
MSMC analysis of population separation times. (A) Separation times were calculated for each of the five reference individuals (French, Andreapol Russian, Mansi, Evenk, and Han). Reference populations are shown at the top (inside the orange rounded rectangles). Each reference population column shows MSMC separation time estimates between the reference population and other populations of interest. Populations of interest were sorted according to their separation time from diverging most recently (top) to the oldest (bottom). Separation times are shown on the left side of each graph. Populations with similar times were grouped together. (And) Andreapol; (Ust) Ustyuzhna; (Ob) Objachevo. MSMC separation times under 10,000 yr may be noisy, and therefore, such separation times and corresponding populations are shown in a gray-colored font. (B) MSMC cross-coalescence plots corresponding to divergence between Mansi and five other populations (Nenets, Evenks, French, Andean Highlanders, Dinka). The median separation value (y = 0.5; orange line) was used as a proxy for the population divergence time.