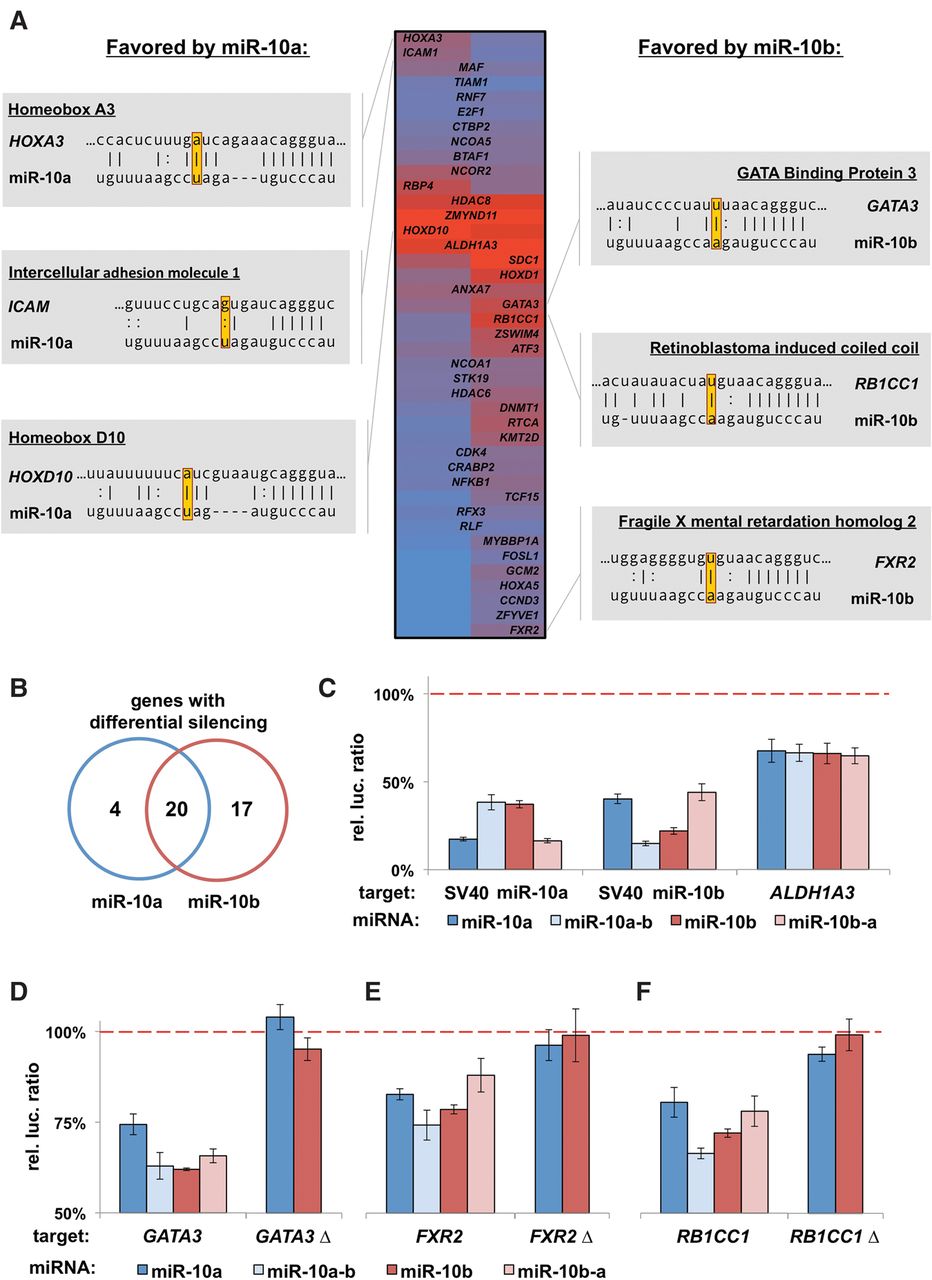
The evolutionary hotspot in the miR-10 family grants target specificity. (A) Heatmap of miR-10a and miR-10b targets showing hits that exhibit repression more than two times the standard error of the 3′ LIFE assay. Genes targeted more strongly by miR-10a or miR-10b are listed on the left or right, respectively. Alignment of top genes with canonical target sites shows that nucleotides in position 12 favor the respective miRNA. (B) Count of genes with differential silencing activity between family members. (C) We reciprocally mutated p12 of each miRNA and tested for the target preference of specific genes with luciferase assays in HEK293T cells (n = 4). Repression of the perfectly complementary sequence in each SV40 3′ UTR shows switching of target preference. ALDH1A3, which contains multiple miR-10 target sites, was not affected by these mutations. Results normalized to a negative control miRNA (dashed line). (D–F) Luciferase assay showing genes favored by miR-10b switch target preference by mutant miRNAs (n = 4). (Δ) Deletion of the miR-10 target site in each 3′ UTR listed in A.