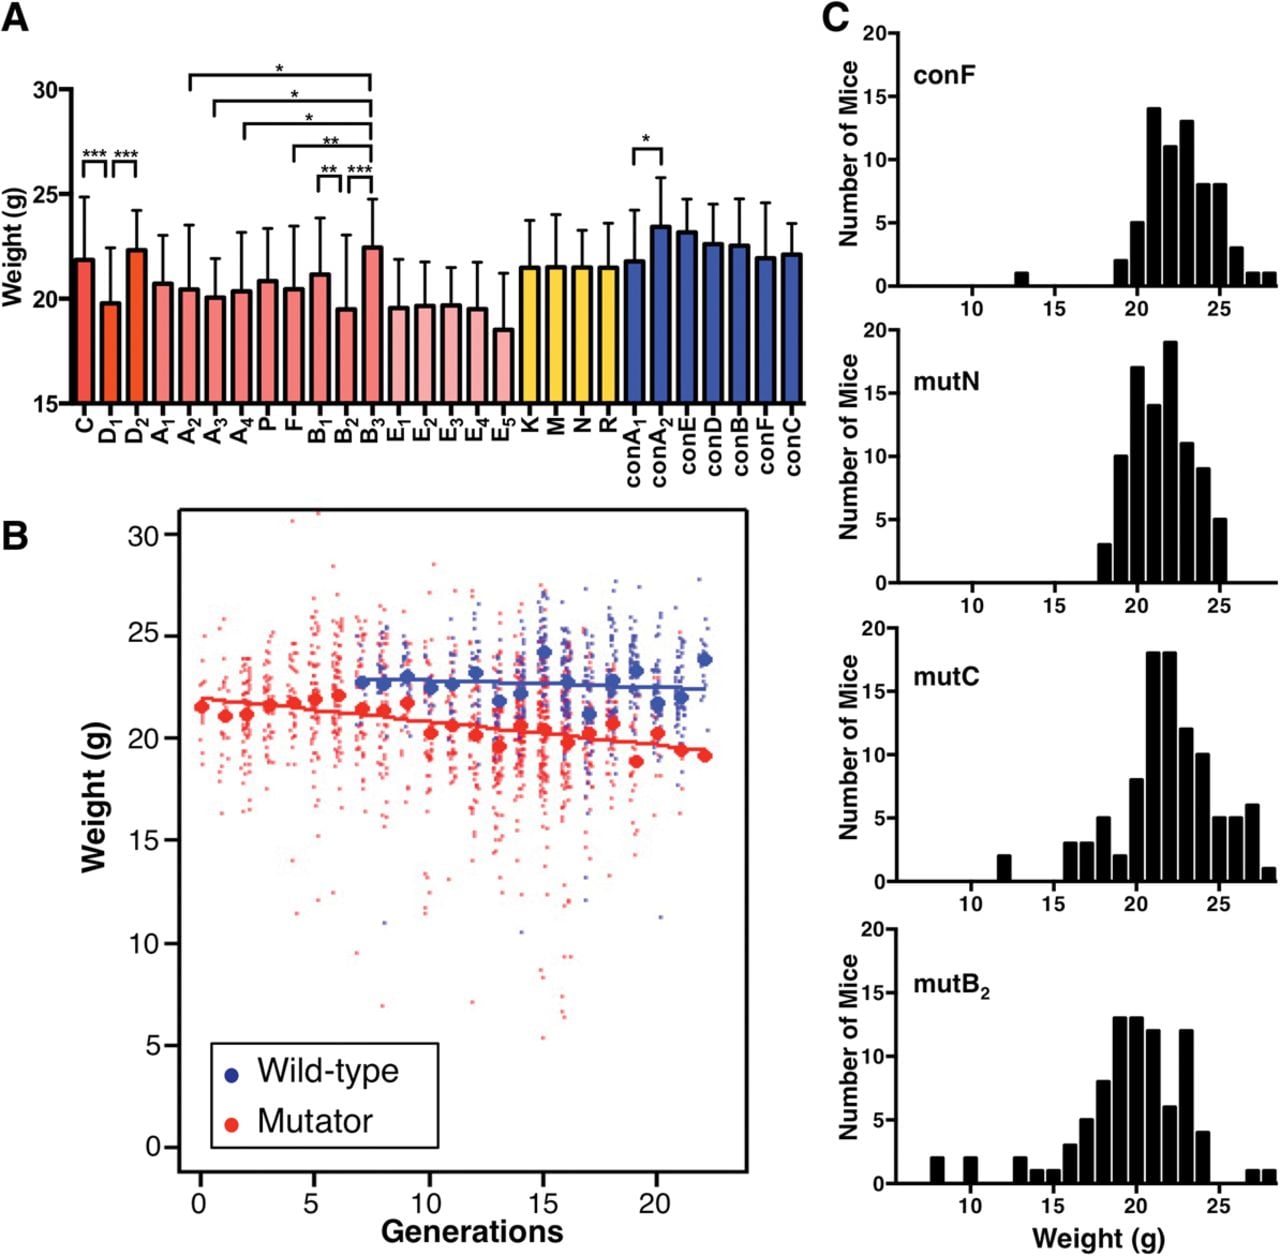
Body-weight changes in breeding lines. (A) Body weights of 8-wk-old males: blue, control; yellow or red, mutator lines. Error bars, SDs. Each data point represents the mean weight in the gray-shaded generations in Figure 1; breeding-line names correspond to the sublines in Figure 1. (*) Statistically significant differences between sublines belonging to the same subgroup ([C∼D2], [A1∼B3], [E1∼E5], [K∼R], and [conA1∼conC]), by Tukey's multiple comparison test; (*) P < 0.05, (**) P < 0.01, (***) P < 0.001. (B) Body weights of 8-wk-old males, plotted against the number of generations: red, mutator; blue, control. Weights of individual mice (dots) and means (circles) are shown for each generation. Solid lines show the fit for simple linear regression. (C) Histograms of the male weights in representative breeding lines.