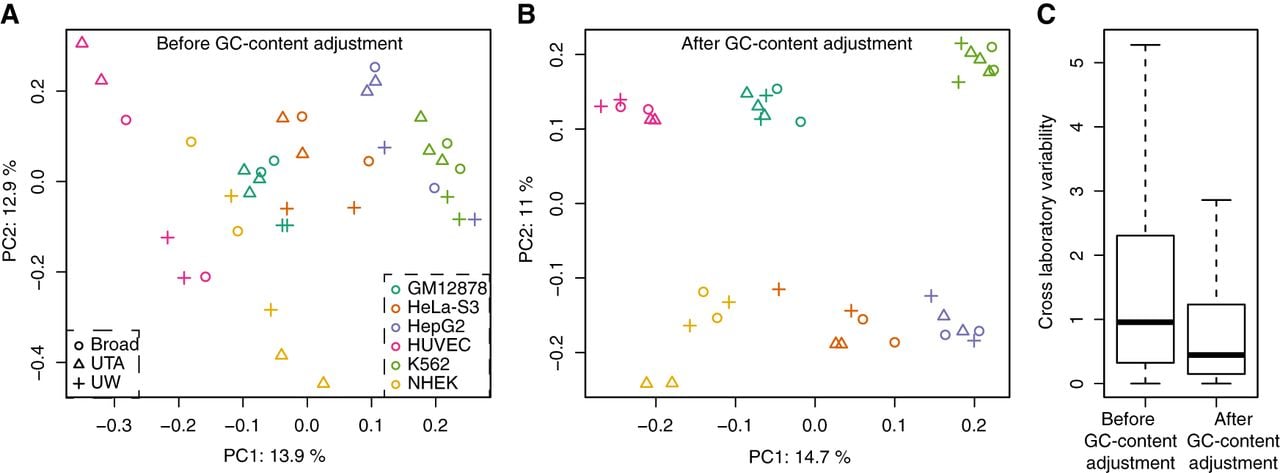
Figure 5.
GC-bias correction reduces the impact of batch effects. (A) For the regions reported as binding sites by ENCODE, we computed counts for the GM12878, HeLa-S3, HepG2, HUVEC, K562, and NHEK for CTCF. The first two principal components of this matrix are shown, with color representing cell line and different symbols used to represent laboratory. (B) As in A but after performing the batch correction. (C) Box plots showing the within cell line across laboratory variability before and after correction for the HUVEC cell line.