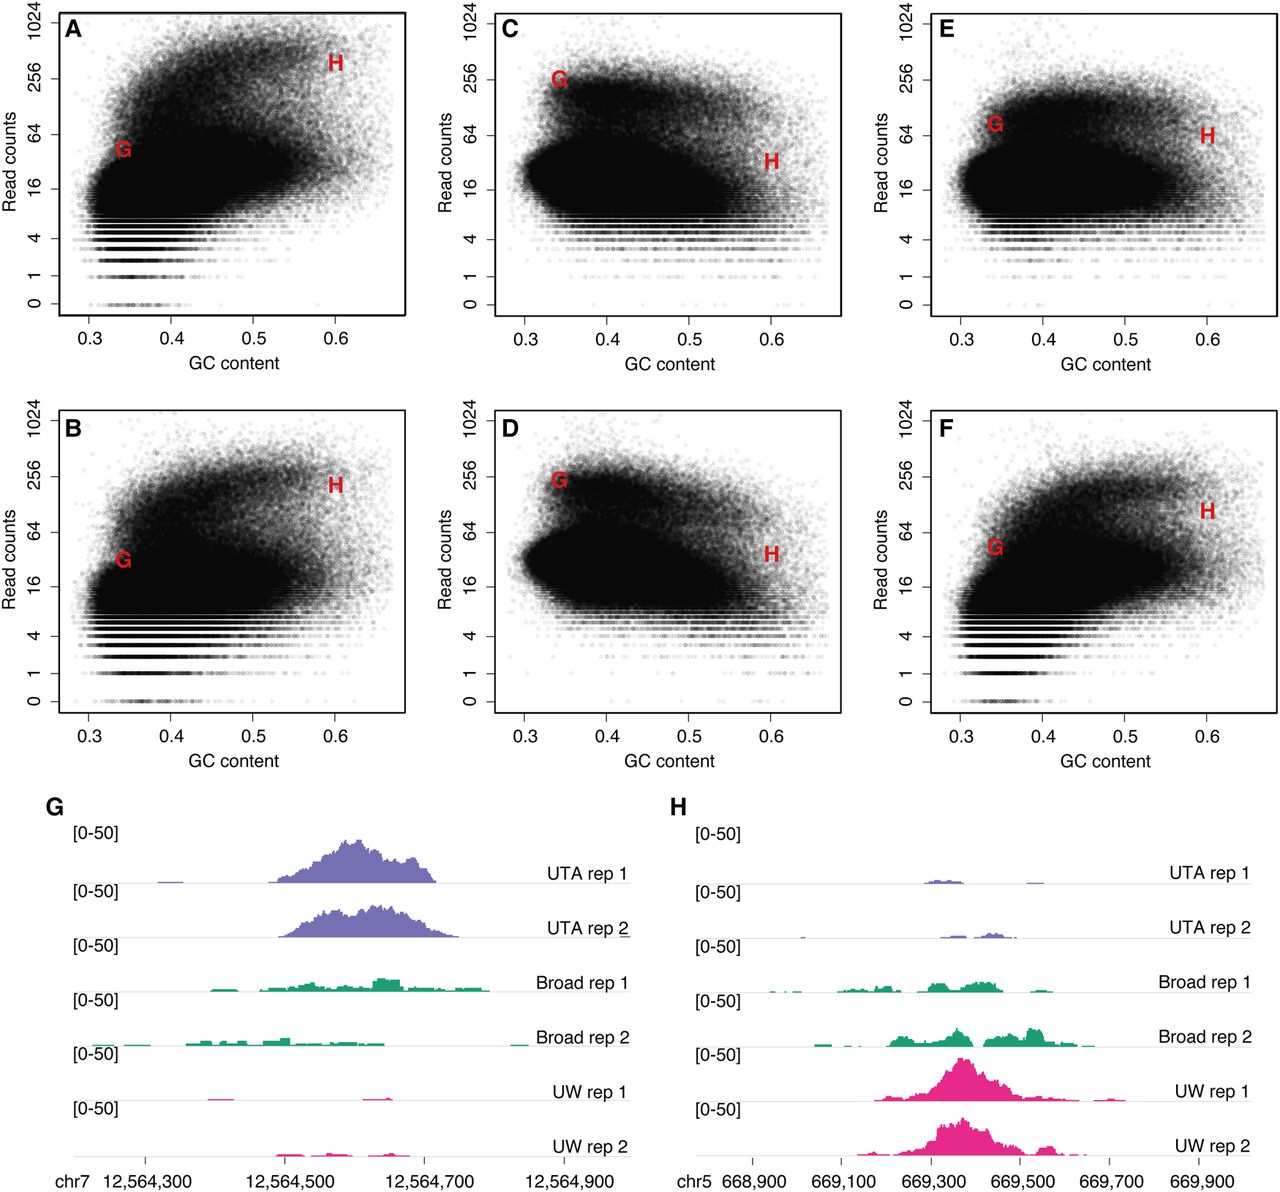
Evidence of GC-content effects at the bin level and its downstream result on peaks demonstrated on the CTCF HUVEC cell line. (A) The genome is divided into 10-kb bins and counts are computed in the first replicate of laboratory UW as well as the GC content of each bin. Counts are plotted against GC content. (B) As in A but for the second replicate. (C) As in A but for the first replicate of laboratory UTA. (D) As in C but for the second replicate. (E) As in A but for the first replicate of laboratory Broad. (F) As in E but for the second replicate. (G,H) Examples of two peaks that change substantially from laboratory to laboratory. The peaks shown in G and H were selected to illustrate how coverage plots can change from laboratory to laboratory and that the change appears to be driven by GC content. These regions are associated with the bins annotated with the letters ‘G’ and ‘H’ in A–F.