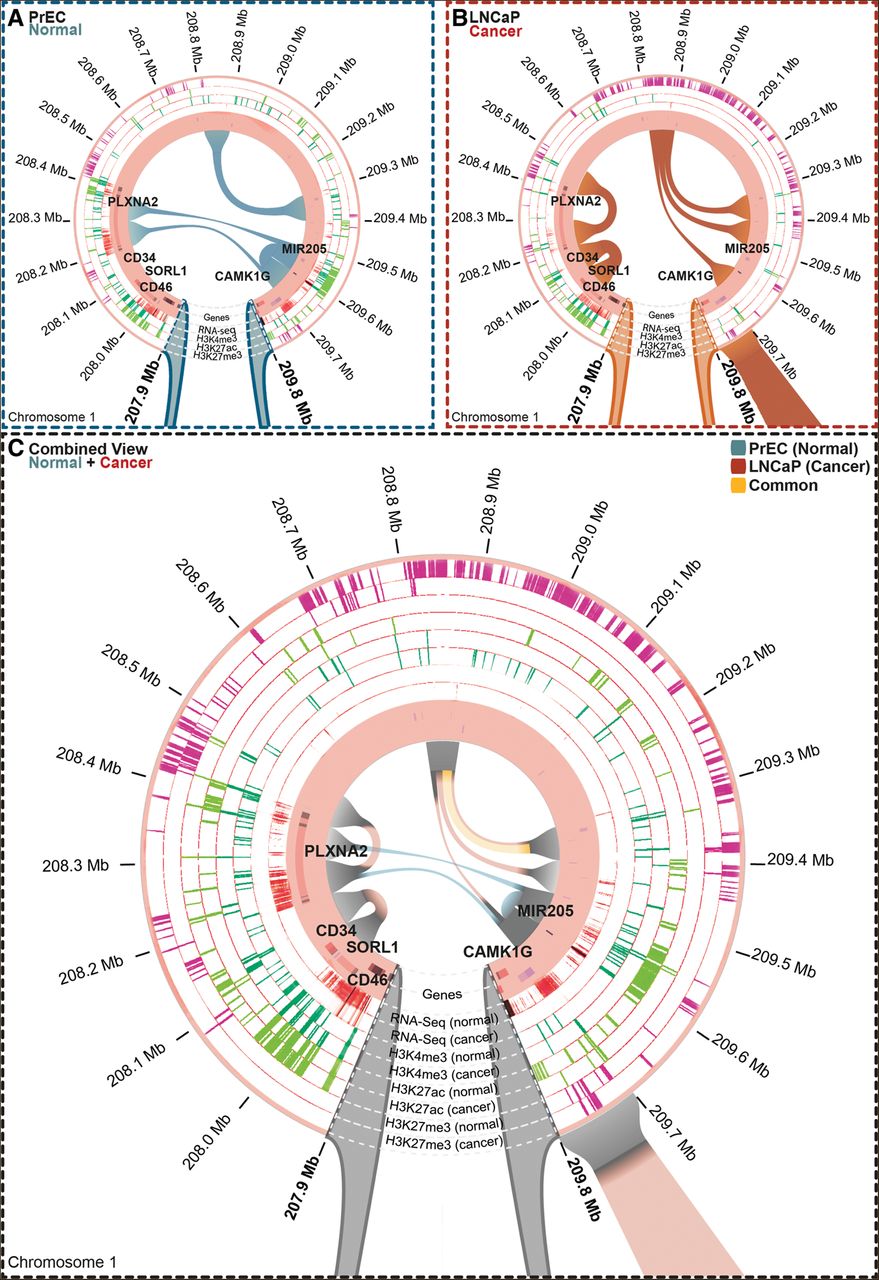
Long-range epigenetically silenced (LRES) domains occur at differential interactions in cancer cells. The majority of LRES regions overlap differential interactions in cancer cells. Anchor points of differential interactions are visualized in Rondo simultaneously with ChIP-seq (H3K27ac, H3K4me3, and H3K27me3), RefSeq genes, and RNA-seq data. (A) In normal PrEC cells, three chromatin interactions (teal) are present across the LRES region within Chr1:207,900,000–209,800,000, which contains highly expressed genes (RNA-seq) and enriched levels of active histone marks (H3K4me3, dark green; H3K27ac, light green). (B) In LNCaP cancer cells, new interactions are observed in this LRES region and occur with concomitant loss of gene expression (RNA-seq) and a marked decrease in active marks (H3K4me3, dark green; H3K27ac, light green) and increase in repressive H3K27me3 (pink). (C) A combined view shows normal and cancer epigenomes, expression and interaction data simultaneously. Those interactions unique to PrEC (normal; teal) and LNCaP (cancer; orange) are evident, while the shared interaction is shown in yellow. The circular tracks depict gene expression (RNA-seq) and histone marks (H3K4me3, dark green; H3K27ac, light green; H3K27me3, pink). Teal lines in the circle depict a loss of chromatin interactions in cancer, and the orange lines depict a gain of interaction in the cancer cells.