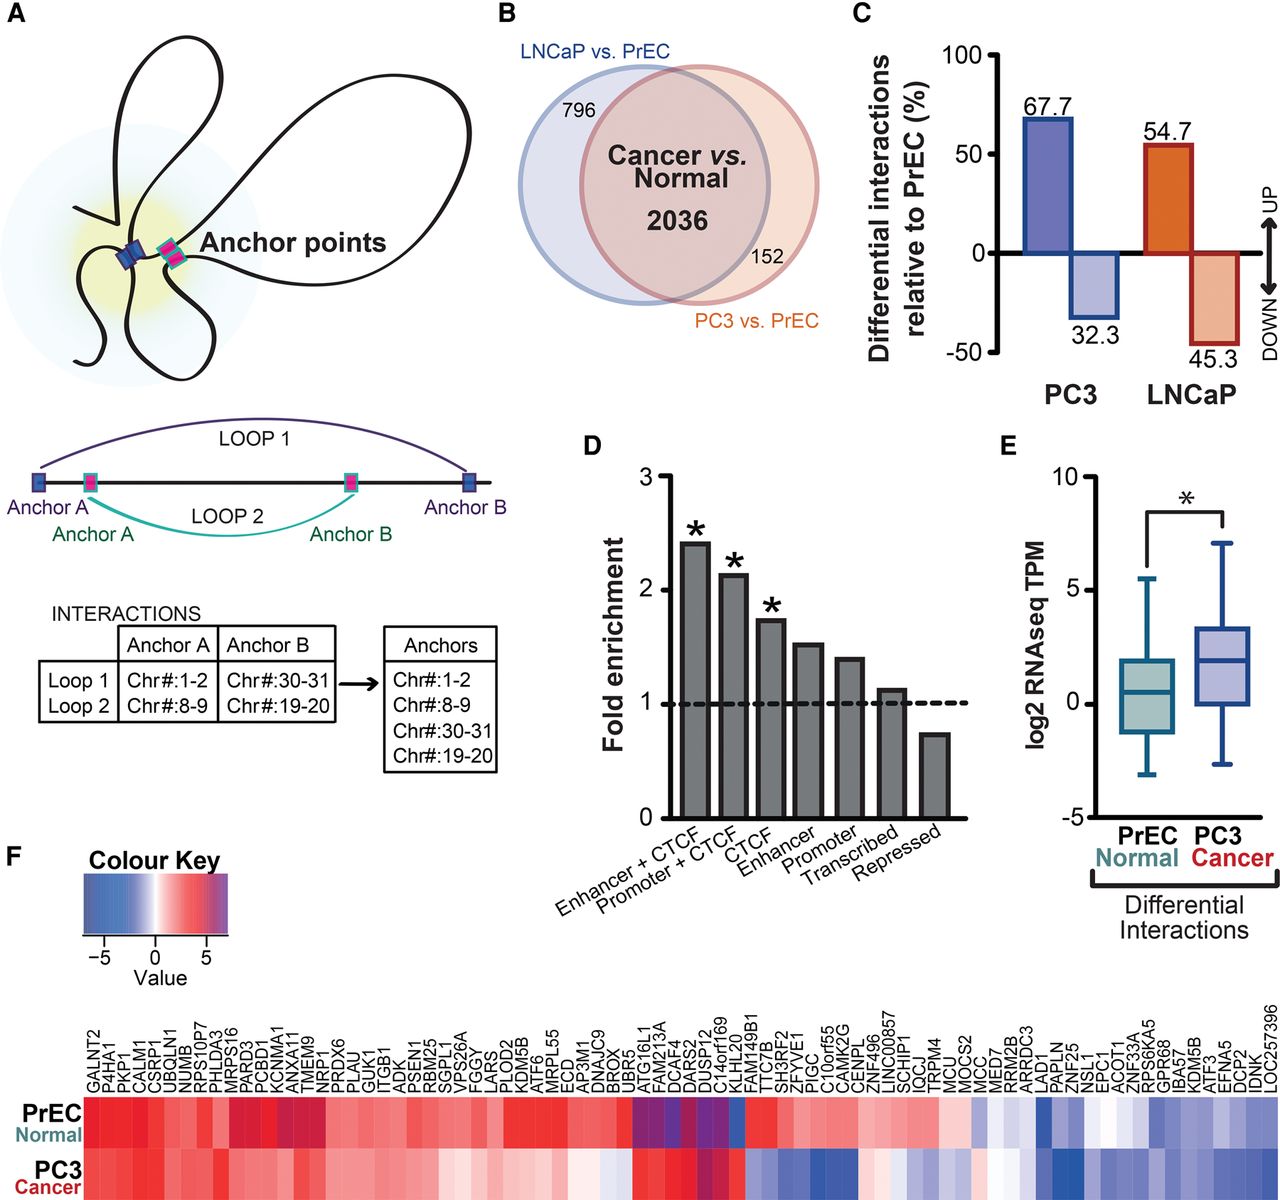
New, cancer-specific interactions explain the majority of differential interactions, which remain within topological domains. (A) Anchor points of chromatin interactions were defined as the genomic locations where an interaction is present. Genomic coordinates of anchor points were exported into a BED file for further analysis. (B) Venn diagram showing anchor points of differential interactions between PrEC and PC3 and between PrEC and LNCaP cell lines (FDR < 5%) and the overlap between them. (C) Differential interactions are enriched in cancer cells. (D) Differential interactions are enriched for enhancers that were marked by CTCF (enhancer + CTCF), promoters marked by CTCF (promoter + CTCF), as well as distal CTCF sites (CTCF). ChIP-seq chromatin states were classified using the ChromHMM hidden Markov model, and data are presented as fold change between the observed enrichment and that expected by random chance. Enrichment was considered significant if the q value < 0.05. (E) Differential interactions are associated with significantly altered gene expression in cancer cells (χ2 OR = 2.482 [95% CI = 1.141–5.400], P = 0.0273). (F) Majority of genes located at the anchor points of differential interactions have increased expression in cancer cells.