Table 4.
Test statistics for natural selection from human variation in the large exons of APOL5 and APOL6 from 24 African Americans
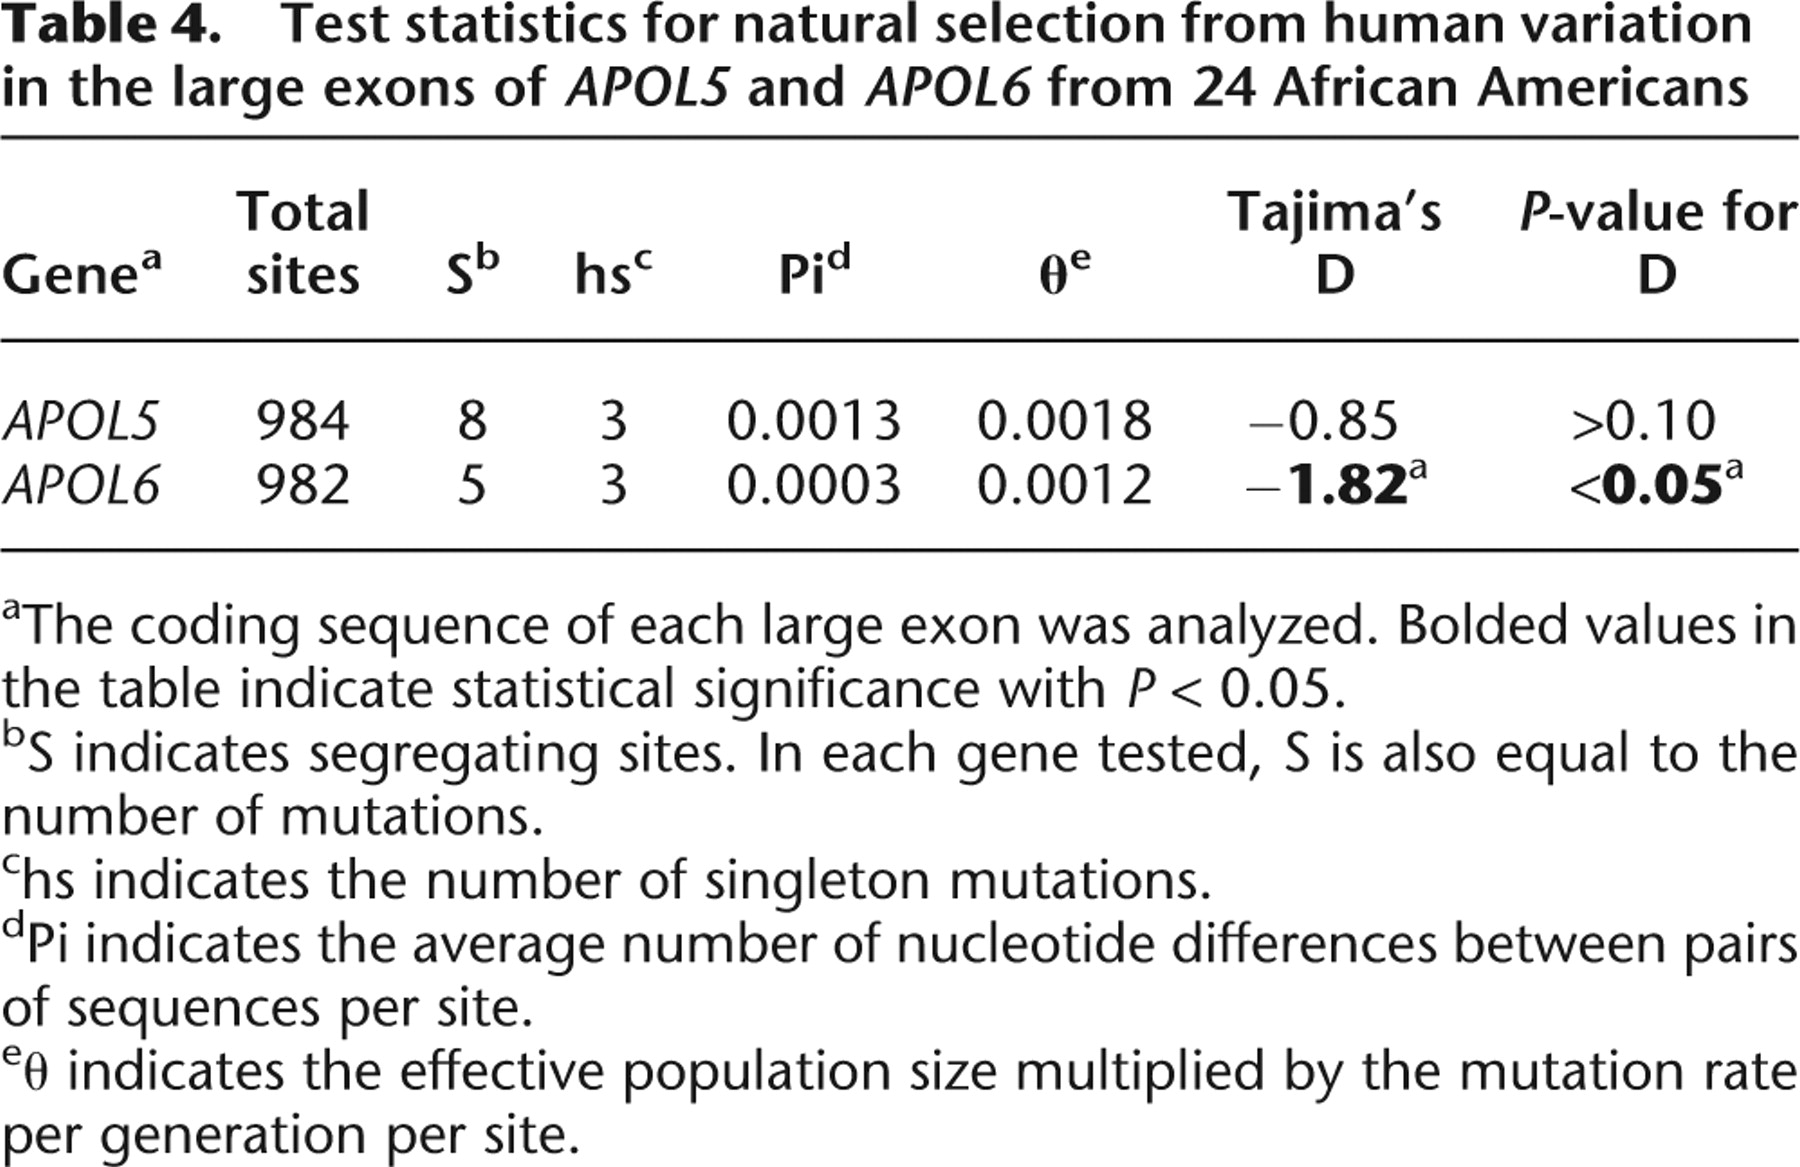
[i] aThe coding sequence of each large exon was analyzed. Bolded values in the table indicate statistical significance with P < 0.05.
[ii] bS indicates segregating sites. In each gene tested, S is also equal to the number of mutations.
[iii] chs indicates the number of singleton mutations.
[iv] dPi indicates the average number of nucleotide differences between pairs of sequences per site.
[v] eθ indicates the effective population size multiplied by the mutation rate per generation per site.