Table 4.
Correlation between microarray platforms and Illumina GoldenGate reference data (these are computed from the points shown in Fig. 2)
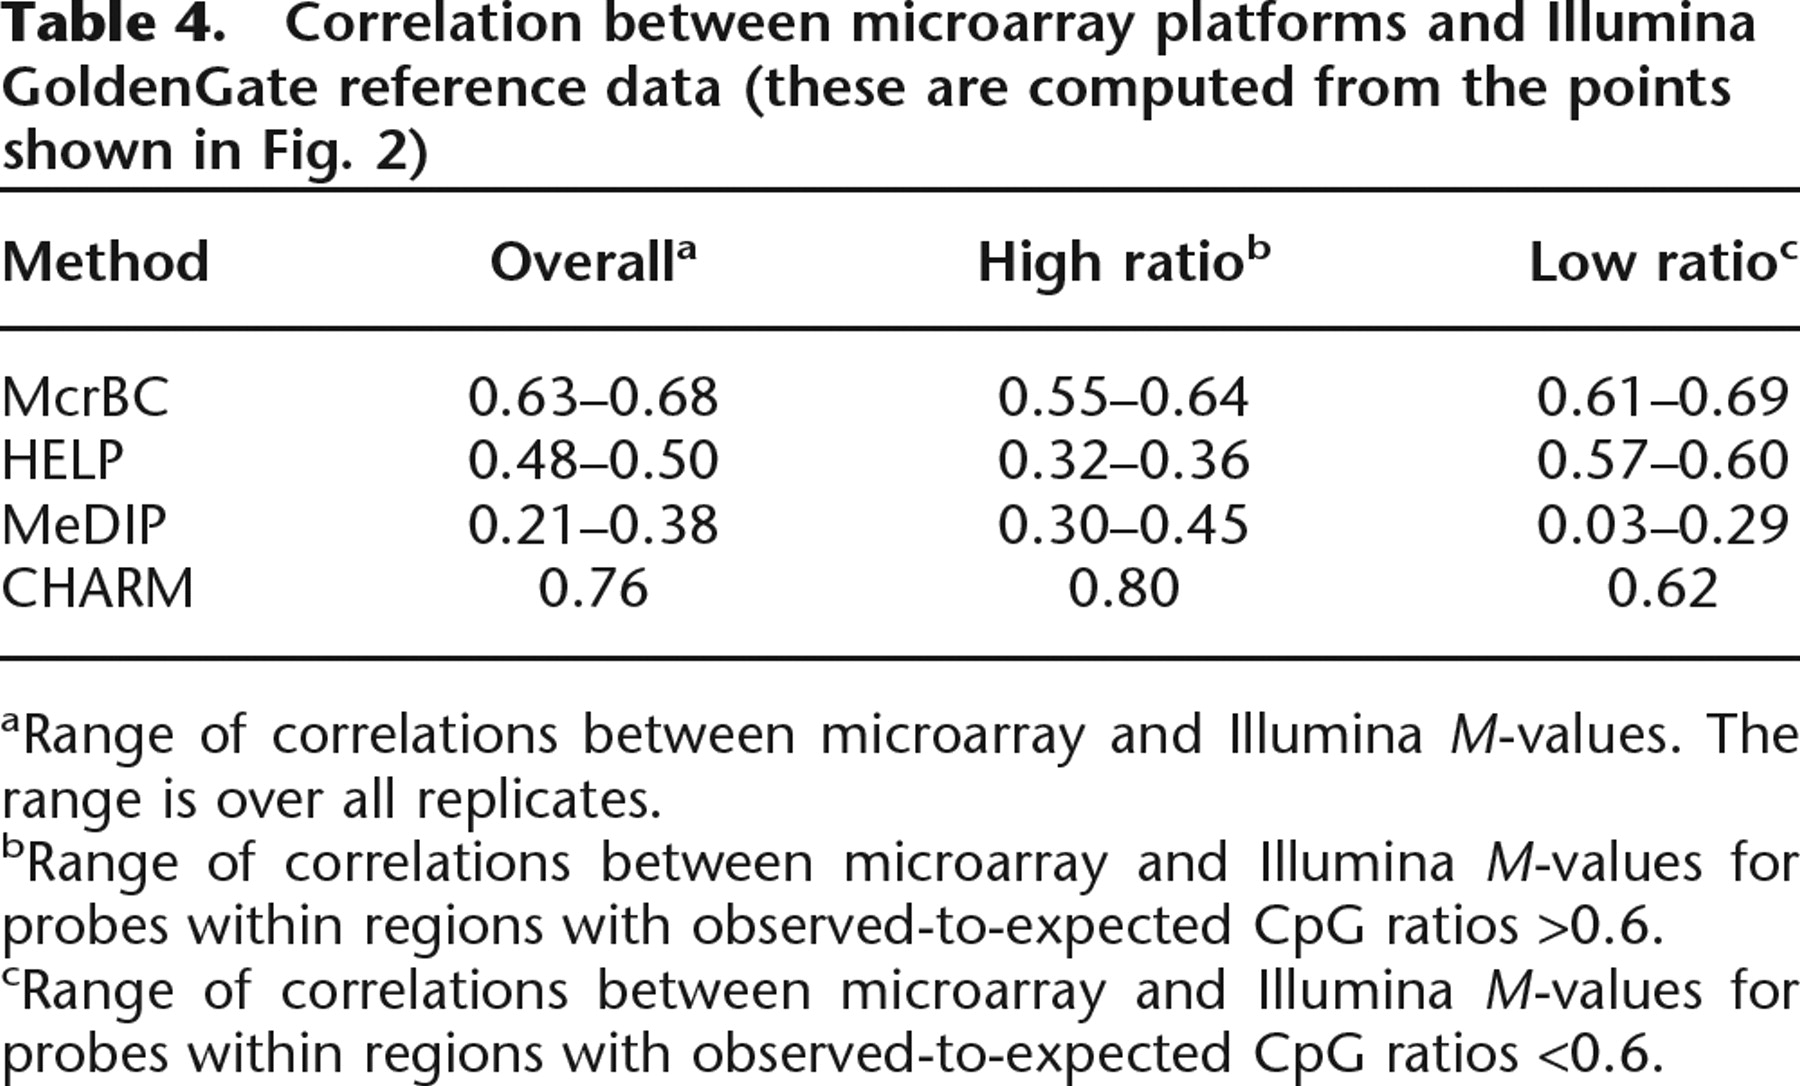
aRange of correlations between microarray and Illumina M-values. The range is over all replicates.
bRange of correlations between microarray and Illumina M-values for probes within regions with observed-to-expected CpG ratios >0.6.
cRange of correlations between microarray and Illumina M-values for probes within regions with observed-to-expected CpG ratios <0.6.