Comparison of low-coverage and high-coverage sequencing reference for imputation into independent samples
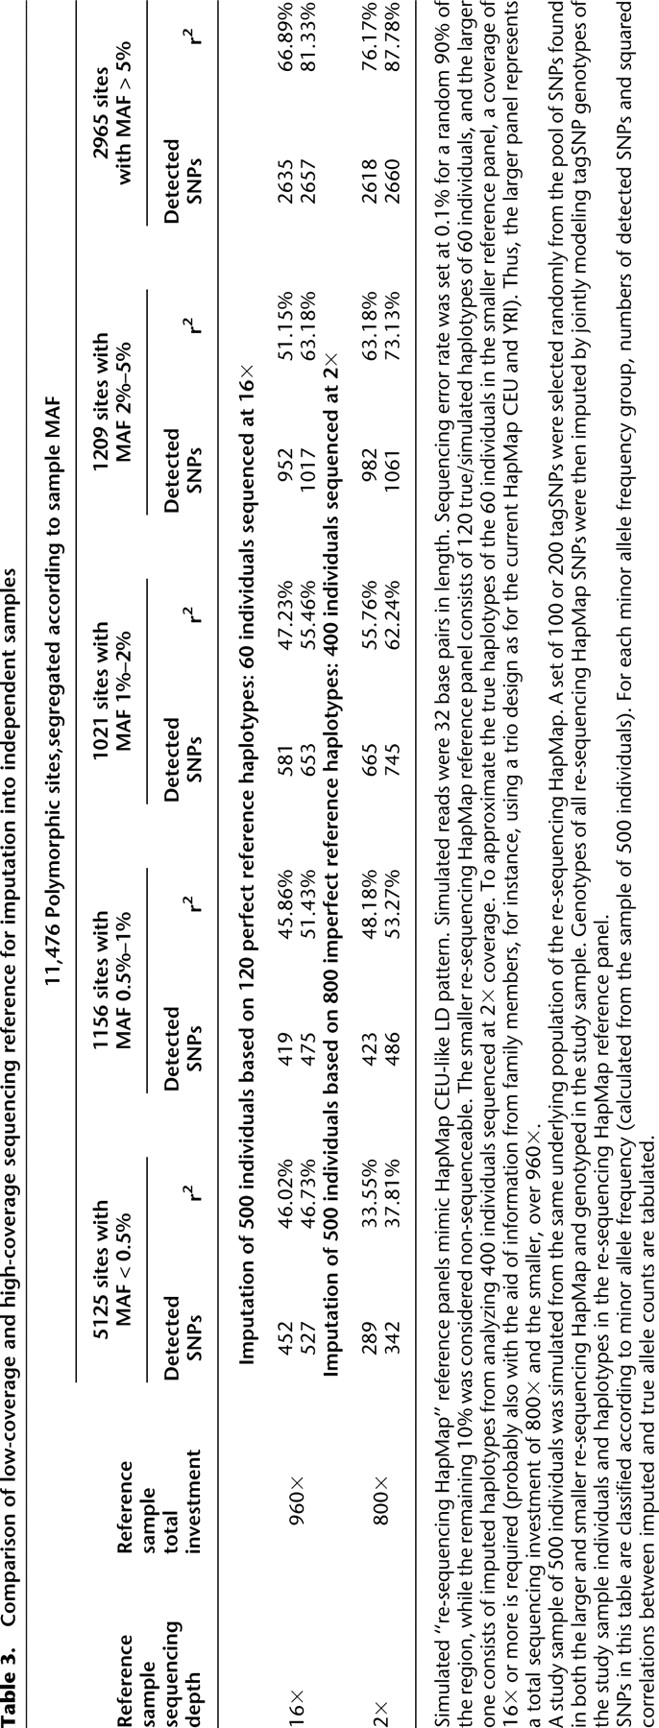
[i] Simulated “re-sequencing HapMap” reference panels mimic HapMap CEU-like LD pattern. Simulated reads were 32 base pairs in length. Sequencing error rate was set at 0.1% for a random 90% of the region, while the remaining 10% was considered non-sequenceable. The smaller re-sequencing HapMap reference panel consists of 120 true/simulated haplotypes of 60 individuals, and the larger one consists of imputed haplotypes from analyzing 400 individuals sequenced at 2× coverage. To approximate the true haplotypes of the 60 individuals in the smaller reference panel, a coverage of 16× or more is required (probably also with the aid of information from family members, for instance, using a trio design as for the current HapMap CEU and YRI). Thus, the larger panel represents a total sequencing investment of 800× and the smaller, over 960×.
[ii] A study sample of 500 individuals was simulated from the same underlying population of the re-sequencing HapMap. A set of 100 or 200 tagSNPs were selected randomly from the pool of SNPs found in both the larger and smaller re-sequencing HapMap and genotyped in the study sample. Genotypes of all re-sequencing HapMap SNPs were then imputed by jointly modeling tagSNP genotypes of the study sample individuals and haplotypes in the re-sequencing HapMap reference panel.
[iii] SNPs in this table are classified according to minor allele frequency (calculated from the sample of 500 individuals). For each minor allele frequency group, numbers of detected SNPs and squared correlations between imputed and true allele counts are tabulated.