Table 3.
Pearson r-values and P-values for age associations of the indicated CNS development- and dopamine signaling–related genes in normal subjects and those with schizophrenia
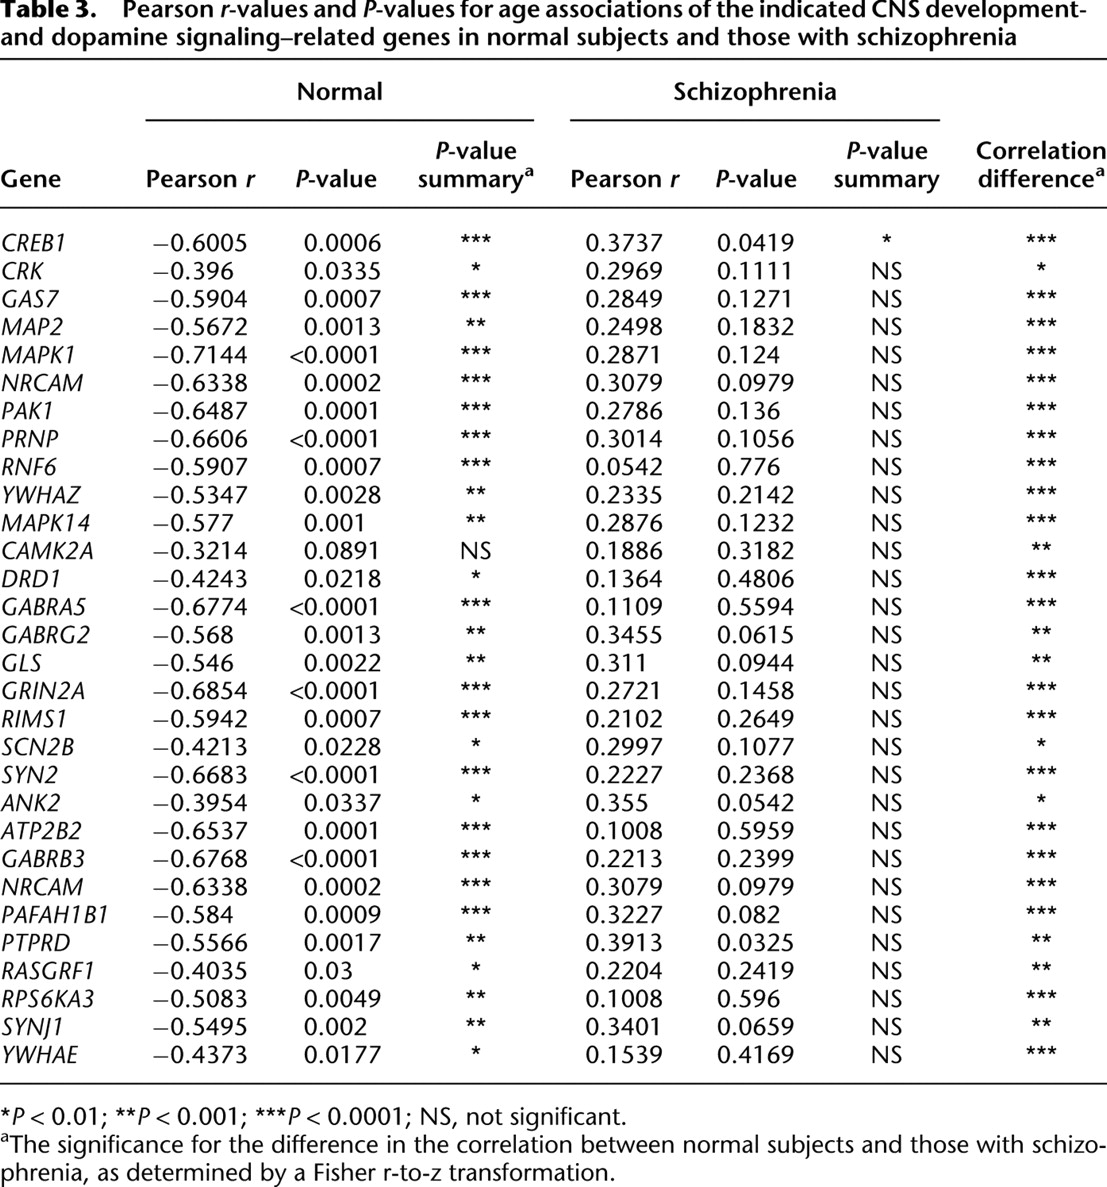
[i] *P < 0.01; **P < 0.001; ***P < 0.0001; NS, not significant.
[ii] aThe significance for the difference in the correlation between normal subjects and those with schizophrenia, as determined by a Fisher r-to-z transformation.