Table 3.
Correlations of LTR-RT structures and variation with GR rates and gene densities
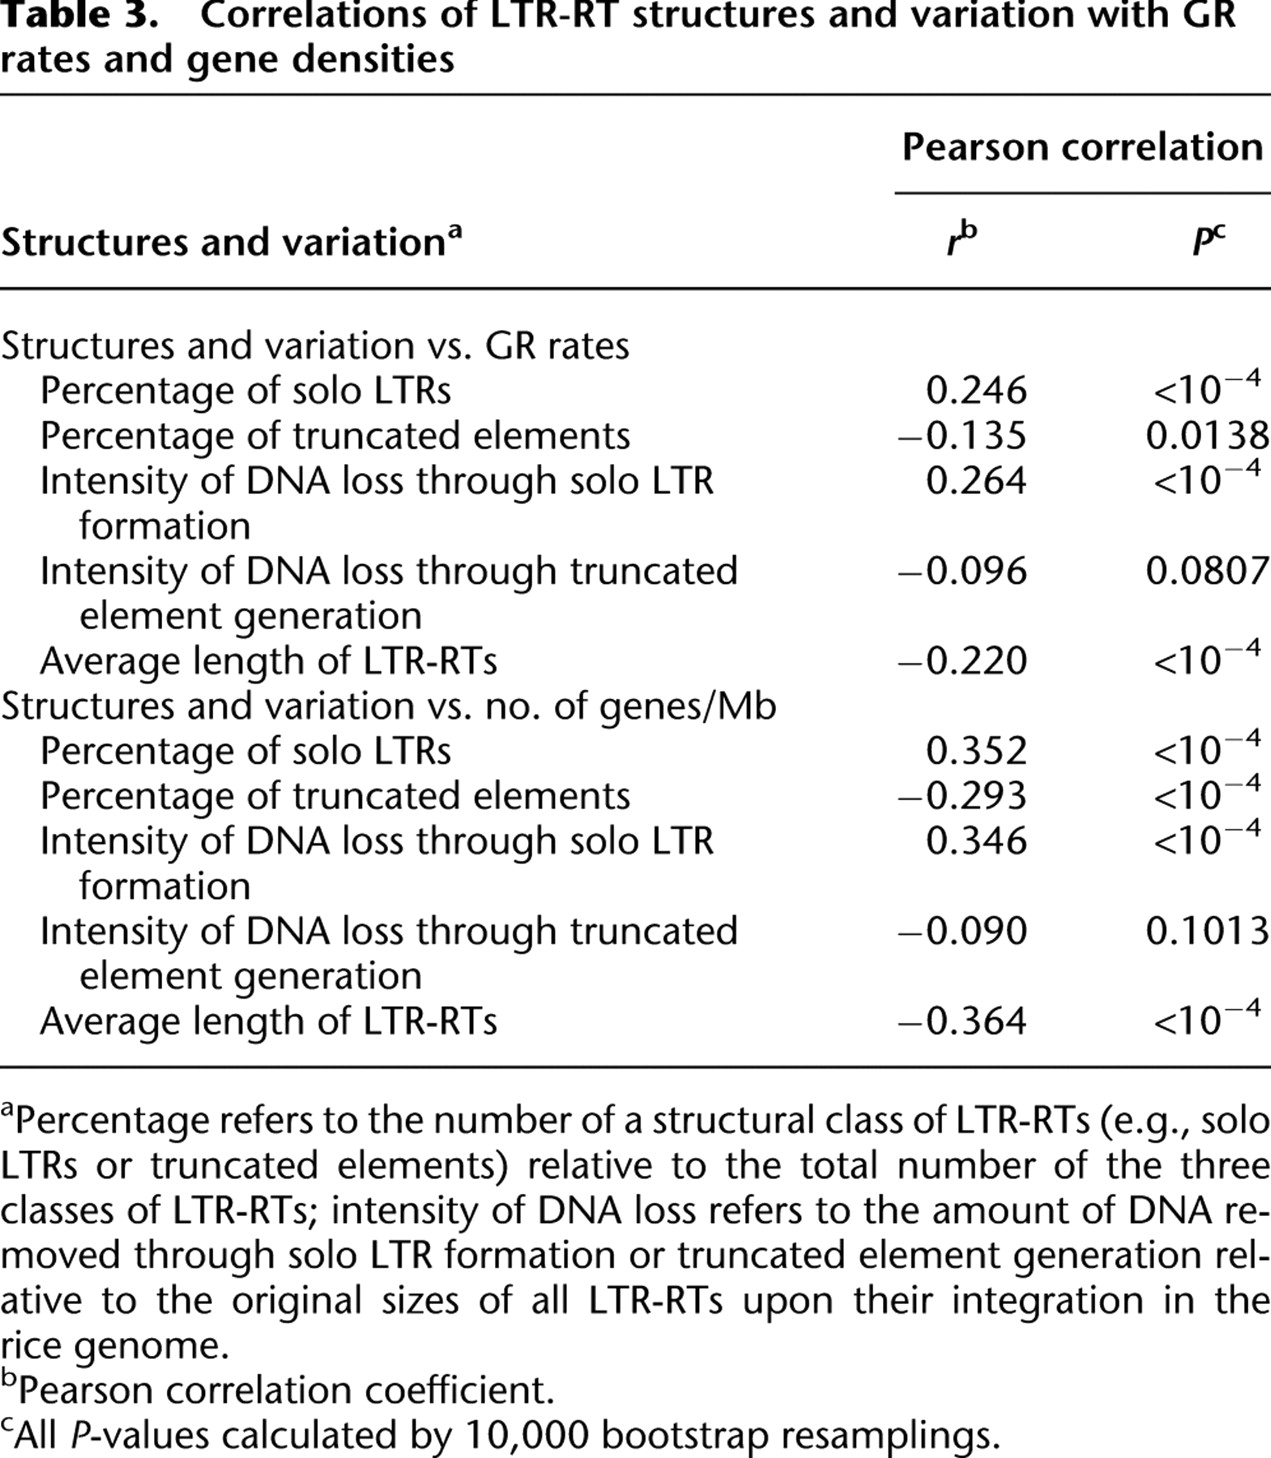
[i] aPercentage refers to the number of a structural class of LTR-RTs (e.g., solo LTRs or truncated elements) relative to the total number of the three classes of LTR-RTs; intensity of DNA loss refers to the amount of DNA removed through solo LTR formation or truncated element generation relative to the original sizes of all LTR-RTs upon their integration in the rice genome.
[ii] bPearson correlation coefficient.
[iii] cAll P-values calculated by 10,000 bootstrap resamplings.