Skip to main content
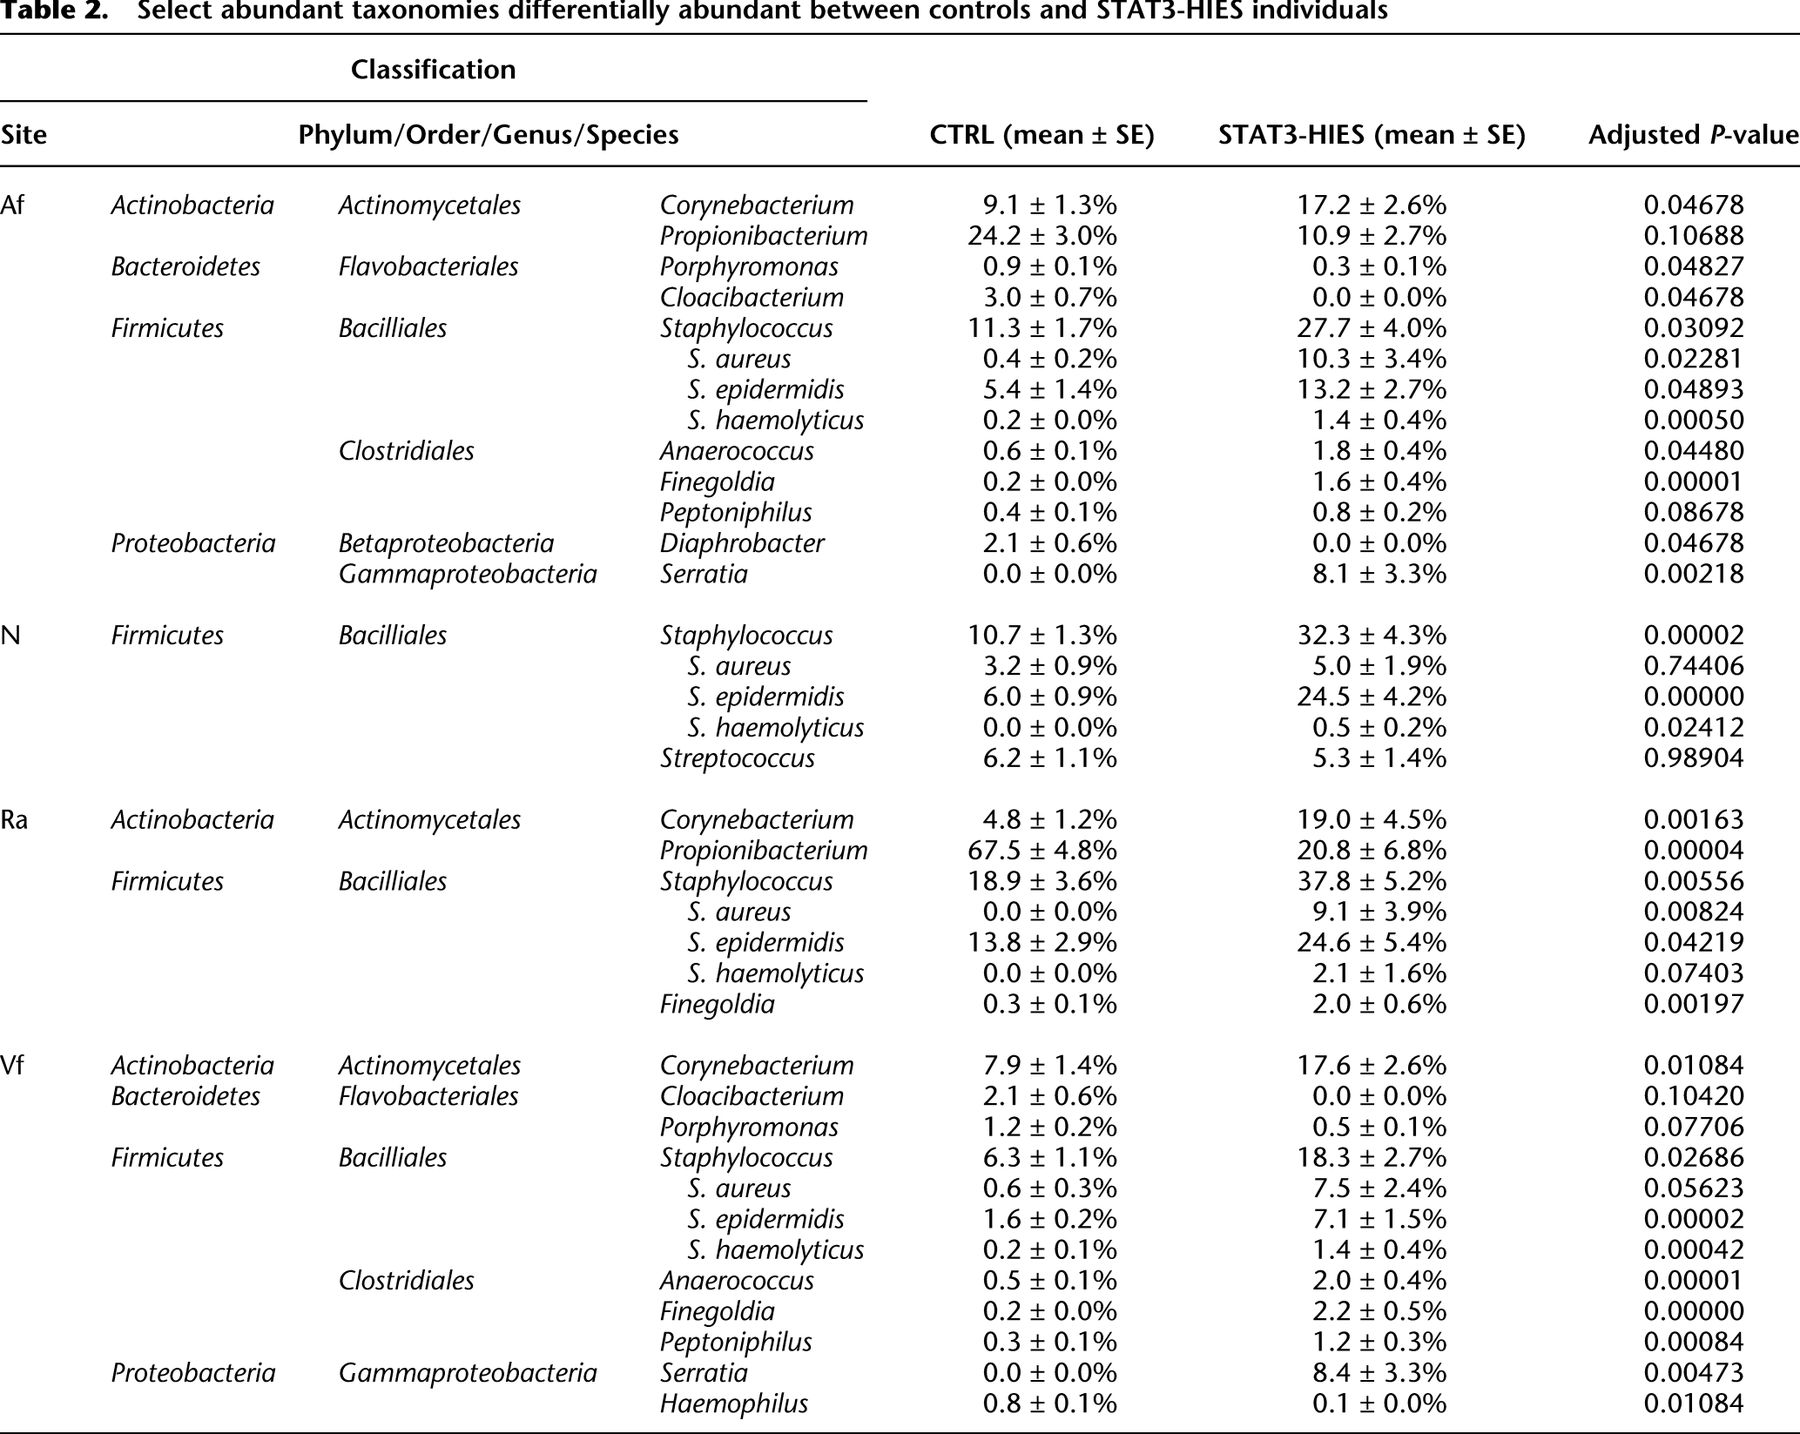
Table 2.
Select abundant taxonomies differentially abundant between controls and STAT3-HIES individuals