Atlas-SNP2 performance comparison with VarScan (Koboldt et al. 2009) and MAQ (Li et al. 2008) when applied in 454 and Illumina platforms
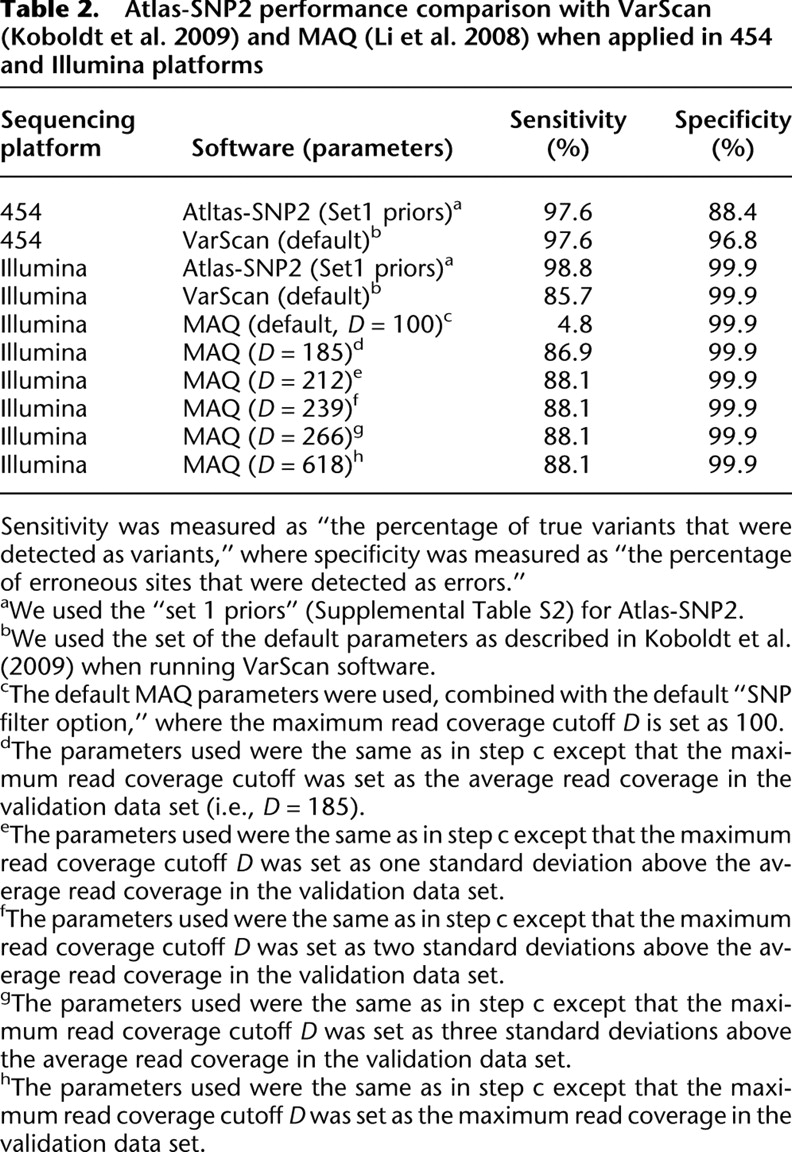
[i] Sensitivity was measured as “the percentage of true variants that were detected as variants,” where specificity was measured as “the percentage of erroneous sites that were detected as errors.”
[ii] aWe used the “set 1 priors” (Supplemental Table S2) for Atlas-SNP2.
[iii] bWe used the set of the default parameters as described in Koboldt et al. (2009) when running VarScan software.
[iv] cThe default MAQ parameters were used, combined with the default “SNP filter option,” where the maximum read coverage cutoff D is set as 100.
[v] dThe parameters used were the same as in step c except that the maximum read coverage cutoff was set as the average read coverage in the validation data set (i.e., D = 185).
[vi] eThe parameters used were the same as in step c except that the maximum read coverage cutoff D was set as one standard deviation above the average read coverage in the validation data set.
[vii] fThe parameters used were the same as in step c except that the maximum read coverage cutoff D was set as two standard deviations above the average read coverage in the validation data set.
[viii] gThe parameters used were the same as in step c except that the maximum read coverage cutoff D was set as three standard deviations above the average read coverage in the validation data set.
[ix] hThe parameters used were the same as in step c except that the maximum read coverage cutoff D was set as the maximum read coverage in the validation data set.