Overlap between previously identified candidate regions and extreme values in the exome data
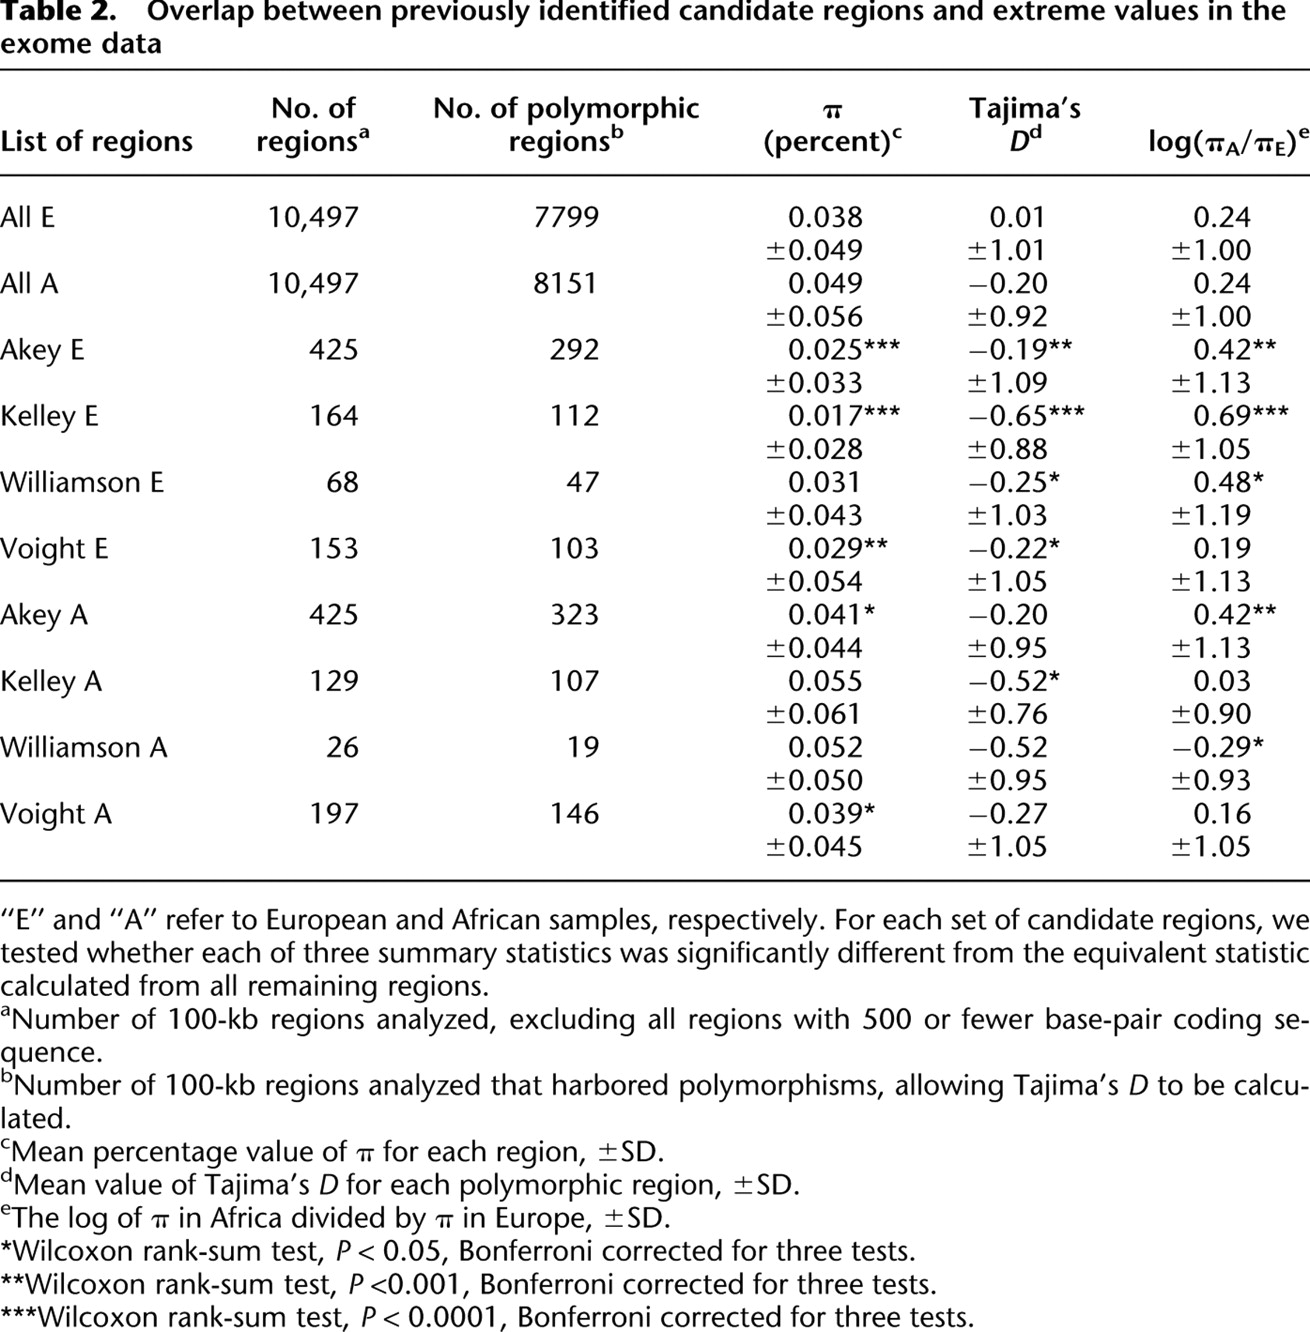
[i] “E” and “A” refer to European and African samples, respectively. For each set of candidate regions, we tested whether each of three summary statistics was significantly different from the equivalent statistic calculated from all remaining regions.
[ii] aNumber of 100-kb regions analyzed, excluding all regions with 500 or fewer base-pair coding sequence.
[iii] bNumber of 100-kb regions analyzed that harbored polymorphisms, allowing Tajima's D to be calculated.
[iv] cMean percentage value of π for each region, ±SD.
[v] dMean value of Tajima's D for each polymorphic region, ±SD.
[vi] eThe log of π in Africa divided by π in Europe, ±SD.
[vii] *Wilcoxon rank-sum test, P < 0.05, Bonferroni corrected for three tests.
[viii] **Wilcoxon rank-sum test, P <0.001, Bonferroni corrected for three tests.
[ix] ***Wilcoxon rank-sum test, P < 0.0001, Bonferroni corrected for three tests.