Table 2.
Sequence analysis of polymorphisms within candidate mouse regions
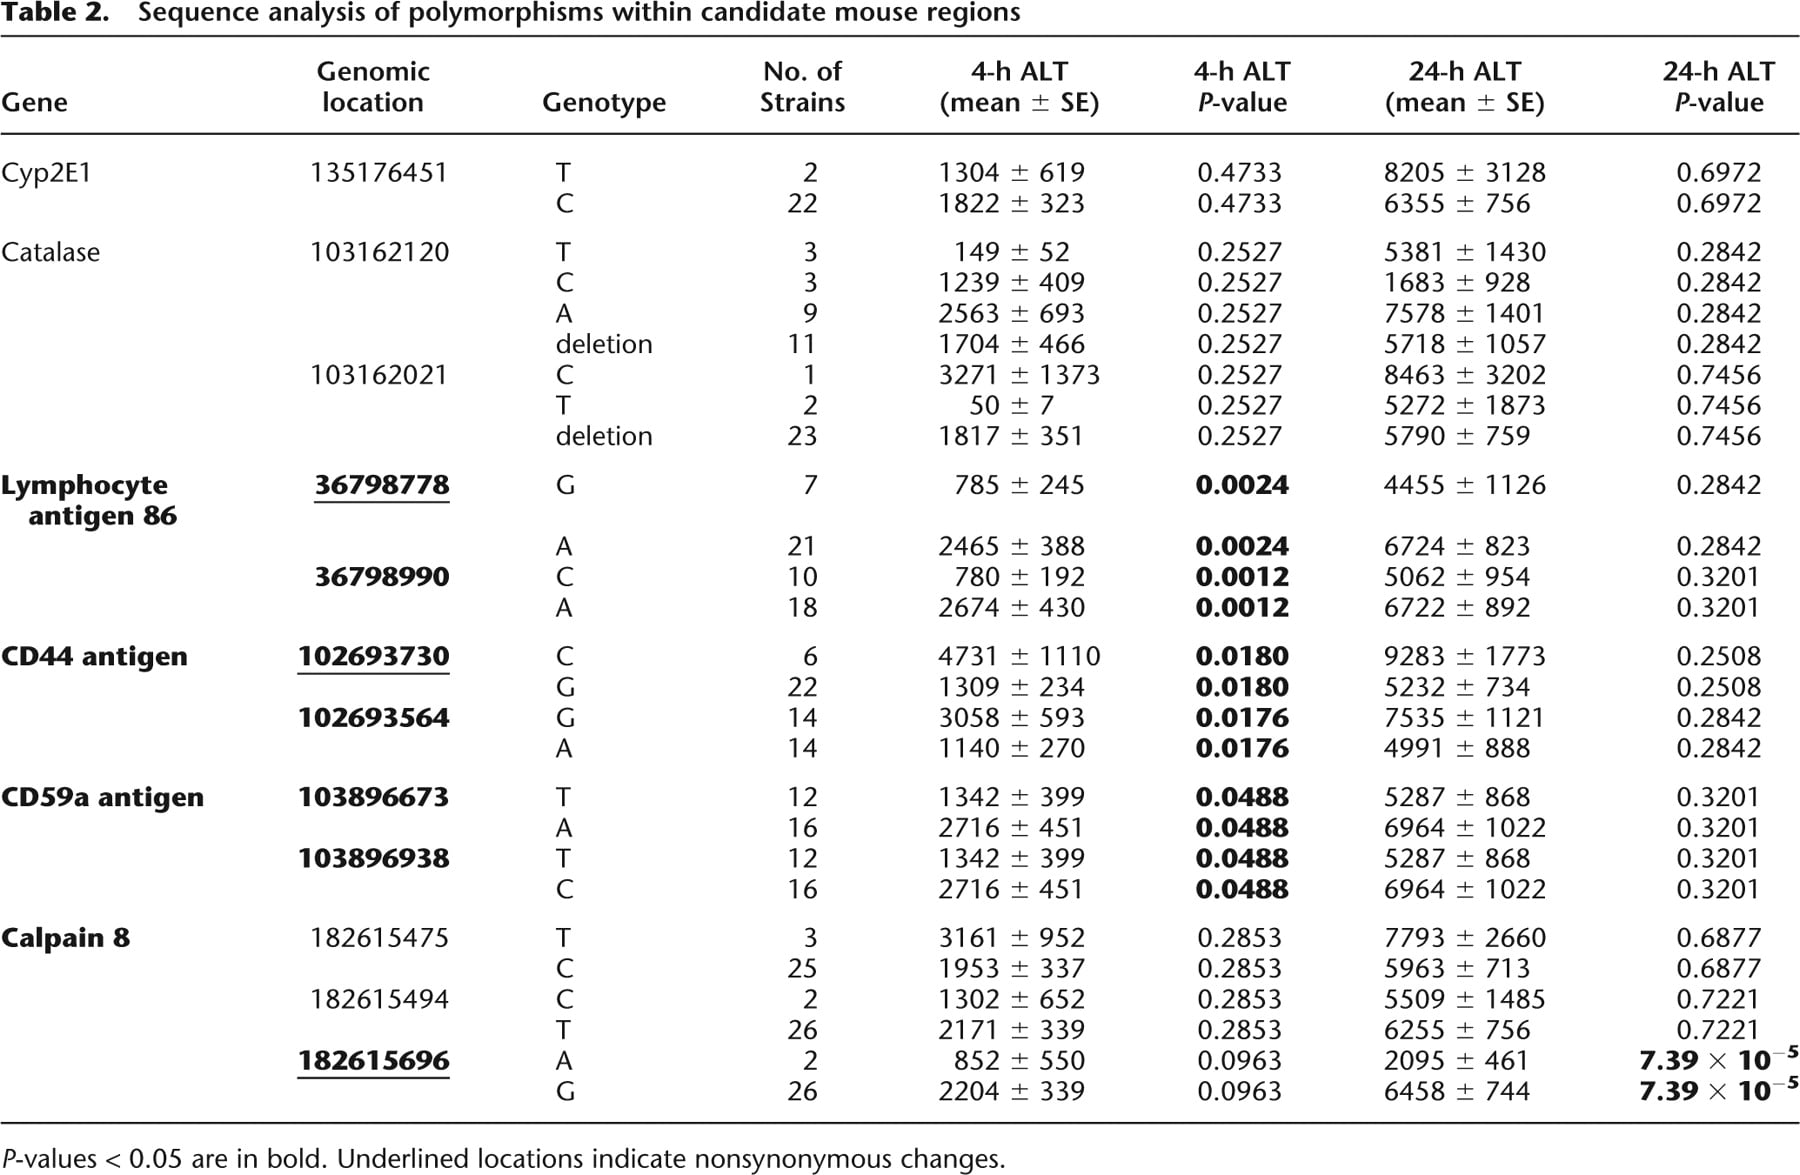
[i] P-values < 0.05 are in bold. Underlined locations indicate nonsynonymous changes.
Sequence analysis of polymorphisms within candidate mouse regions
[i] P-values < 0.05 are in bold. Underlined locations indicate nonsynonymous changes.