Table 2.
Summary statistics for selected BGA regions
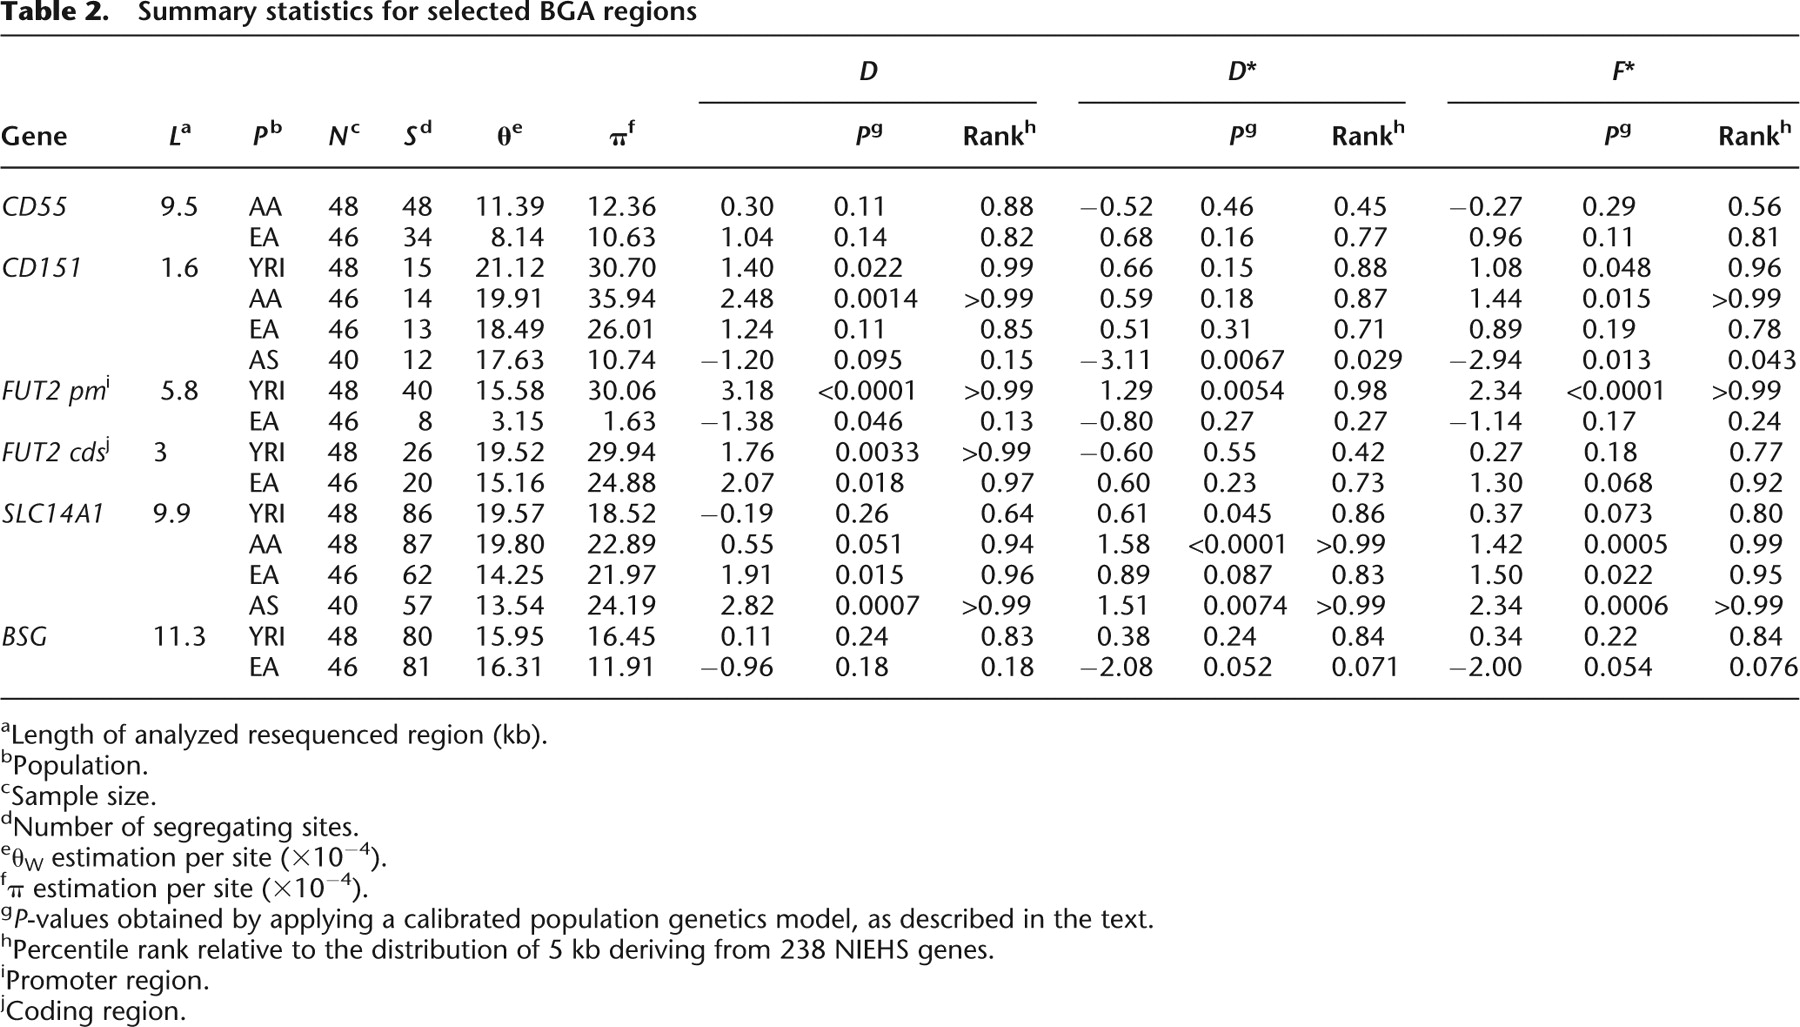
[i] aLength of analyzed resequenced region (kb).
[ii] bPopulation.
[iii] cSample size.
[iv] dNumber of segregating sites.
[v] eθW estimation per site (×10−4).
[vi] fπ estimation per site (×10−4).
[vii] gP-values obtained by applying a calibrated population genetics model, as described in the text.
[viii] hPercentile rank relative to the distribution of 5 kb deriving from 238 NIEHS genes.
[ix] iPromoter region.
[x] jCoding region.