Skip to main content
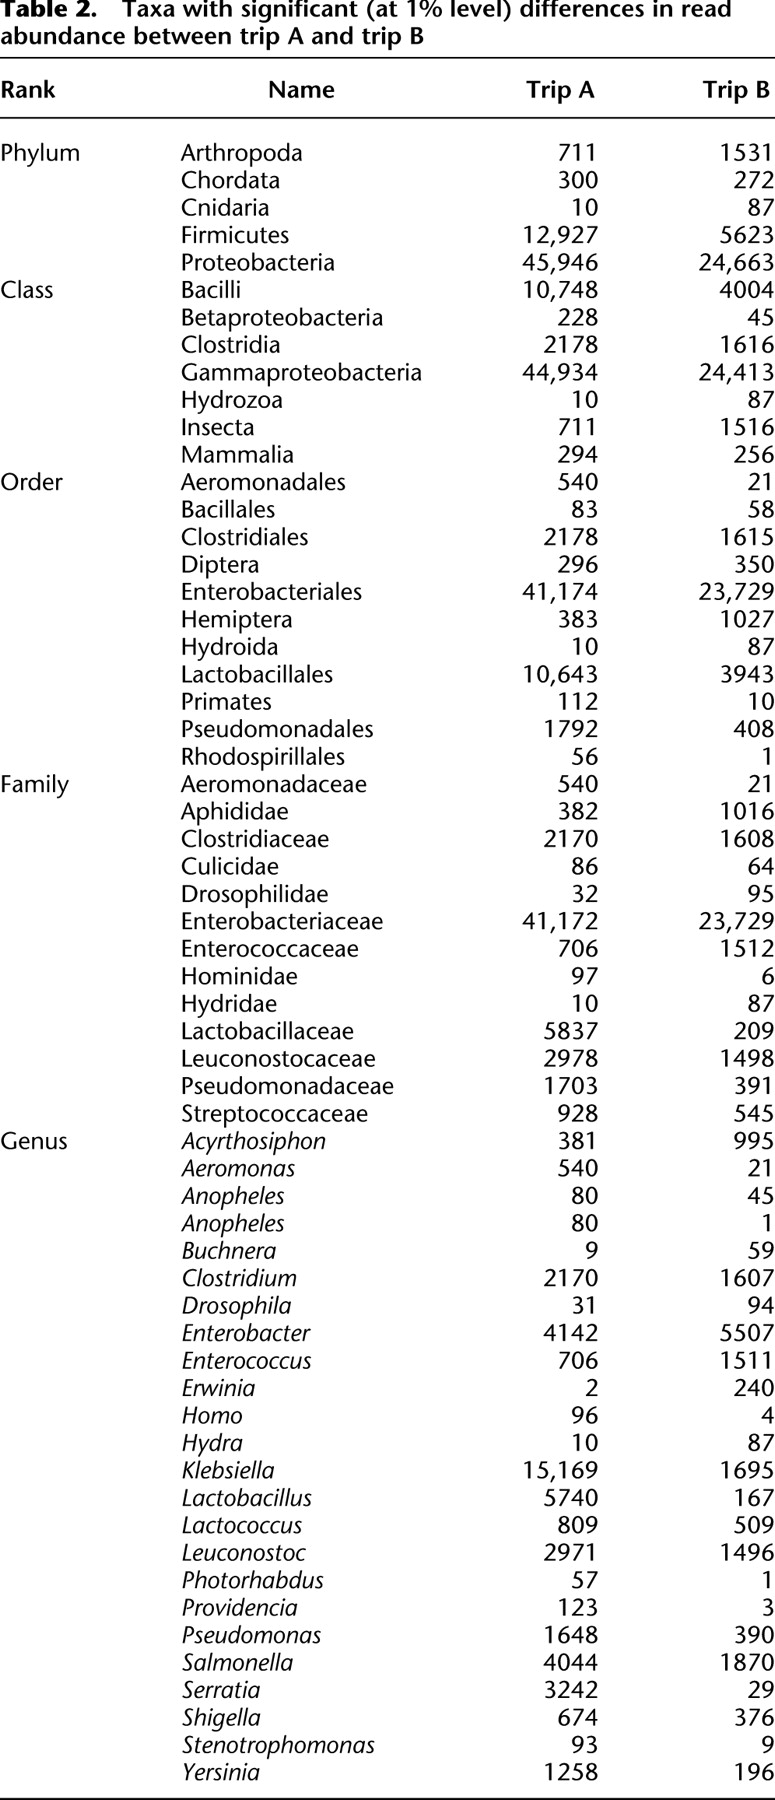
Table 2.
Taxa with significant (at 1% level) differences in read abundance between trip A and trip B