Table 2.
Gene coexpression analysis (correlation coefficient of SAGE data r ± standard error) for genes in hybrid operons, non-hybrid operons, operons in general, and random gene pairs
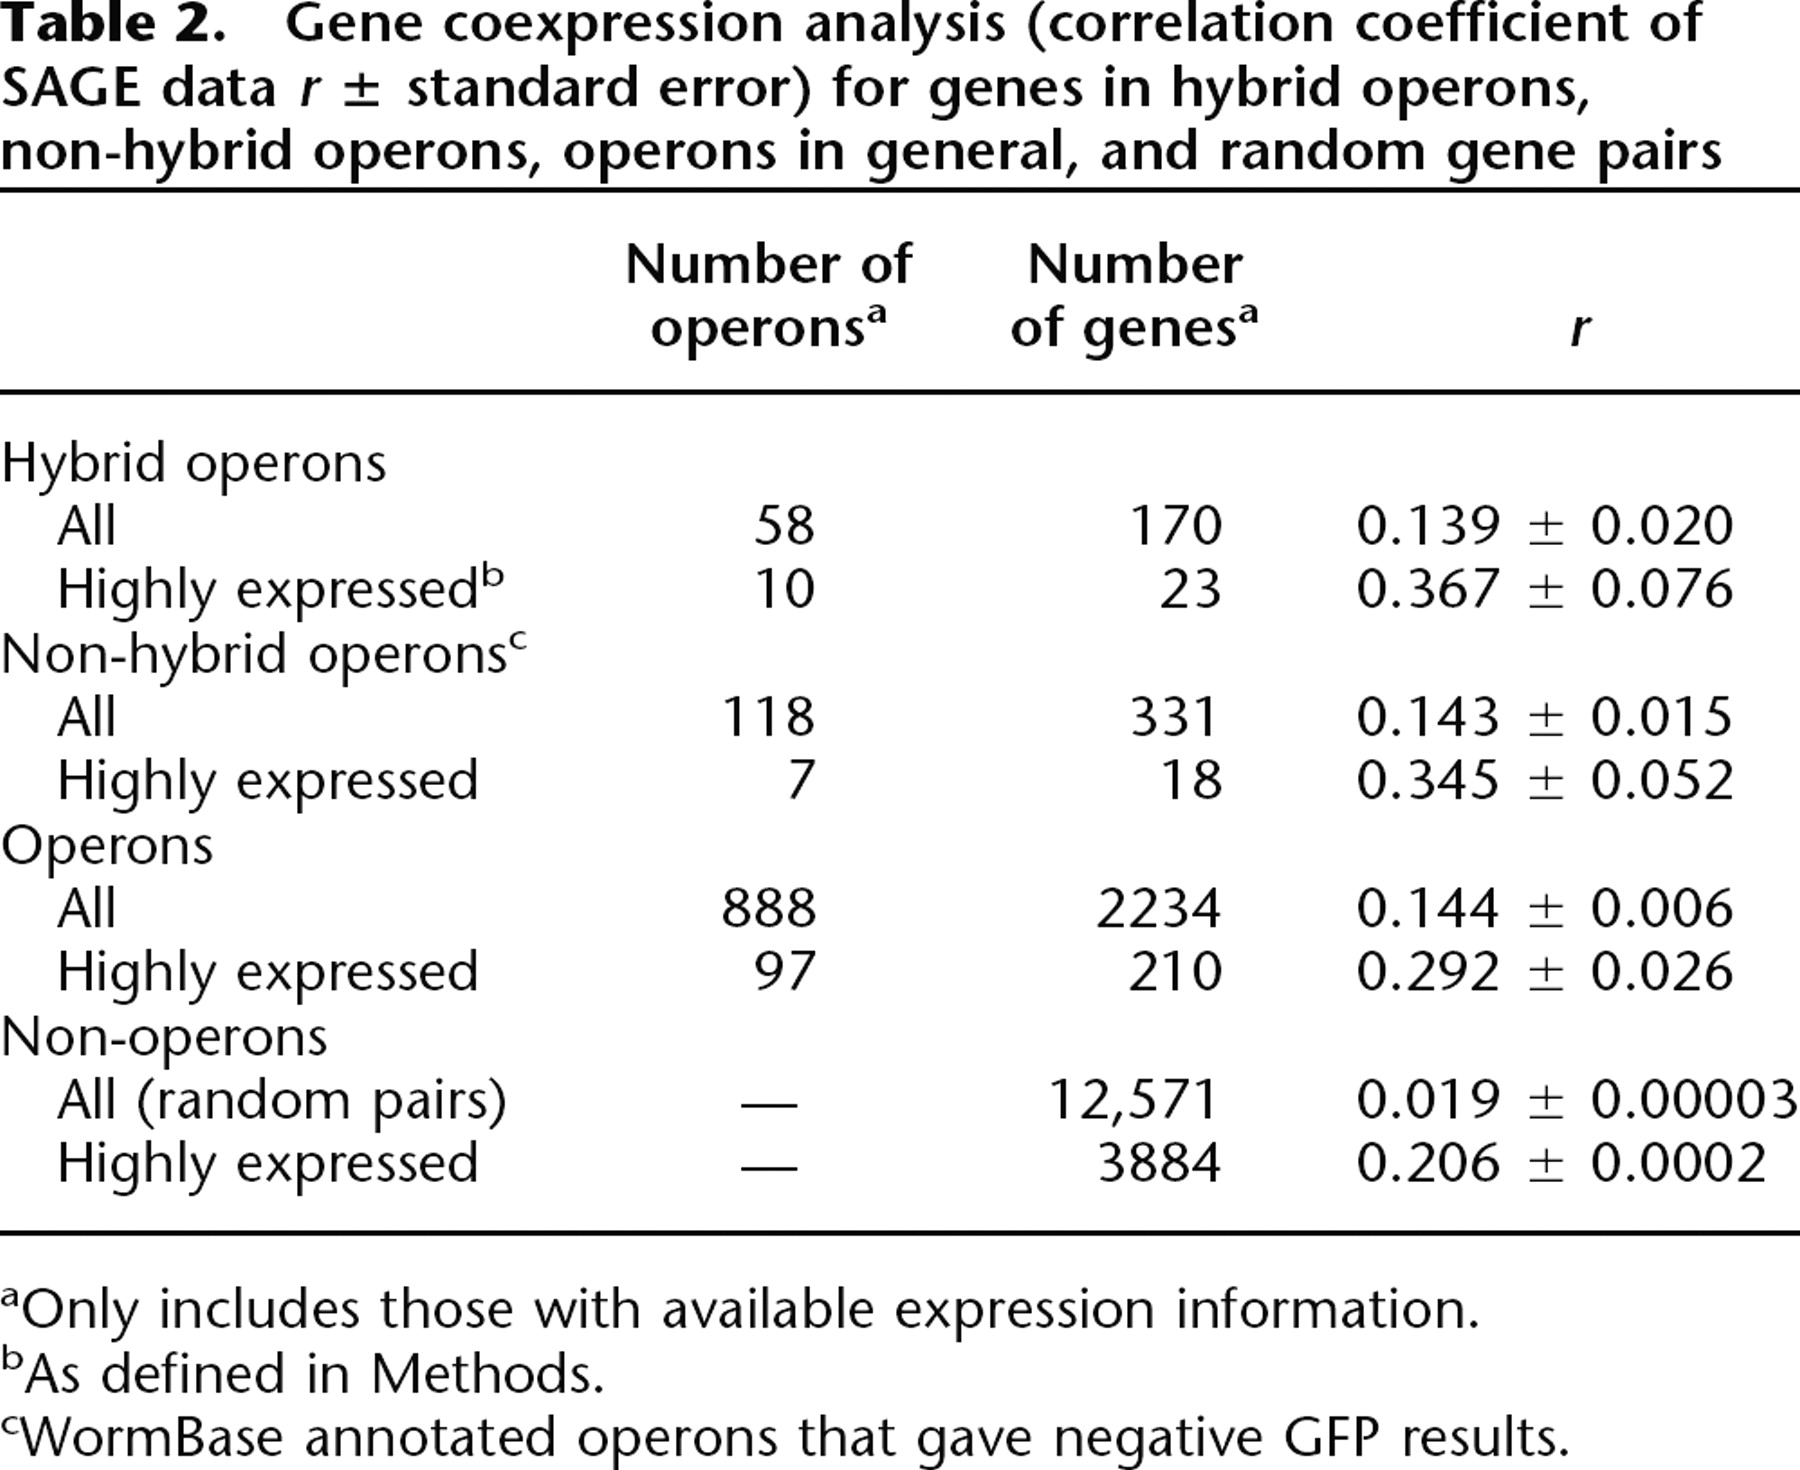
aOnly includes those with available expression information.
bAs defined in Methods.
cWormBase annotated operons that gave negative GFP results.