Origin–gene interactions
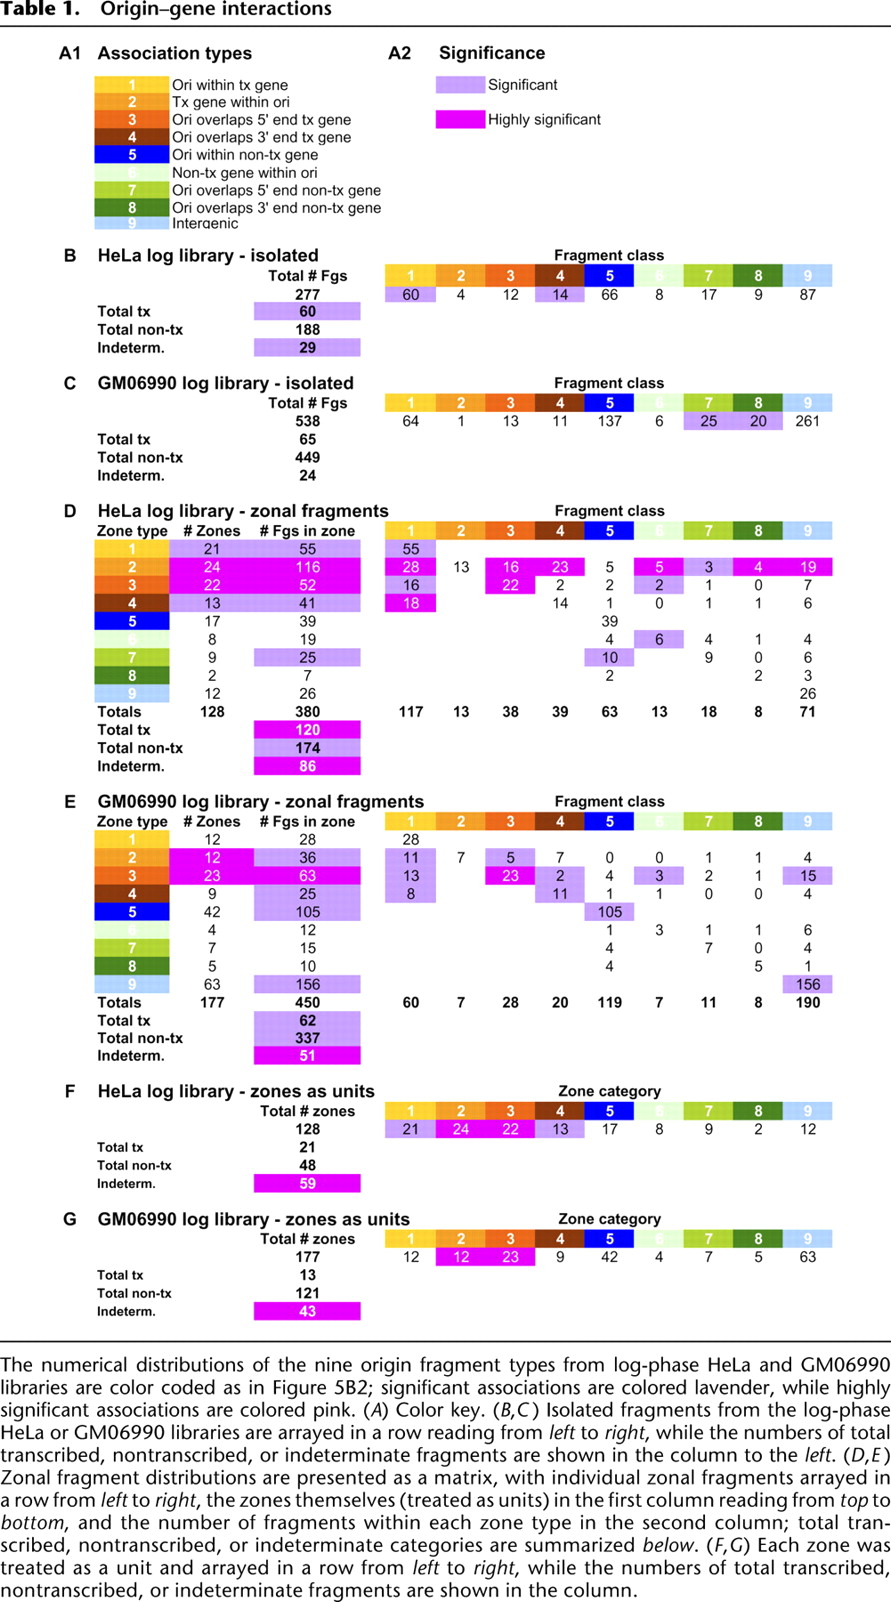
[i] The numerical distributions of the nine origin fragment types from log-phase HeLa and GM06990 libraries are color coded as in Figure 5B2; significant associations are colored lavender, while highly significant associations are colored pink. (A) Color key. (B,C) Isolated fragments from the log-phase HeLa or GM06990 libraries are arrayed in a row reading from left to right, while the numbers of total transcribed, nontranscribed, or indeterminate fragments are shown in the column to the left. (D,E) Zonal fragment distributions are presented as a matrix, with individual zonal fragments arrayed in a row from left to right, the zones themselves (treated as units) in the first column reading from top to bottom, and the number of fragments within each zone type in the second column; total transcribed, nontranscribed, or indeterminate categories are summarized below. (F,G) Each zone was treated as a unit and arrayed in a row from left to right, while the numbers of total transcribed, nontranscribed, or indeterminate fragments are shown in the column.