Multivariate regression analysis of human substitution rates and diversity
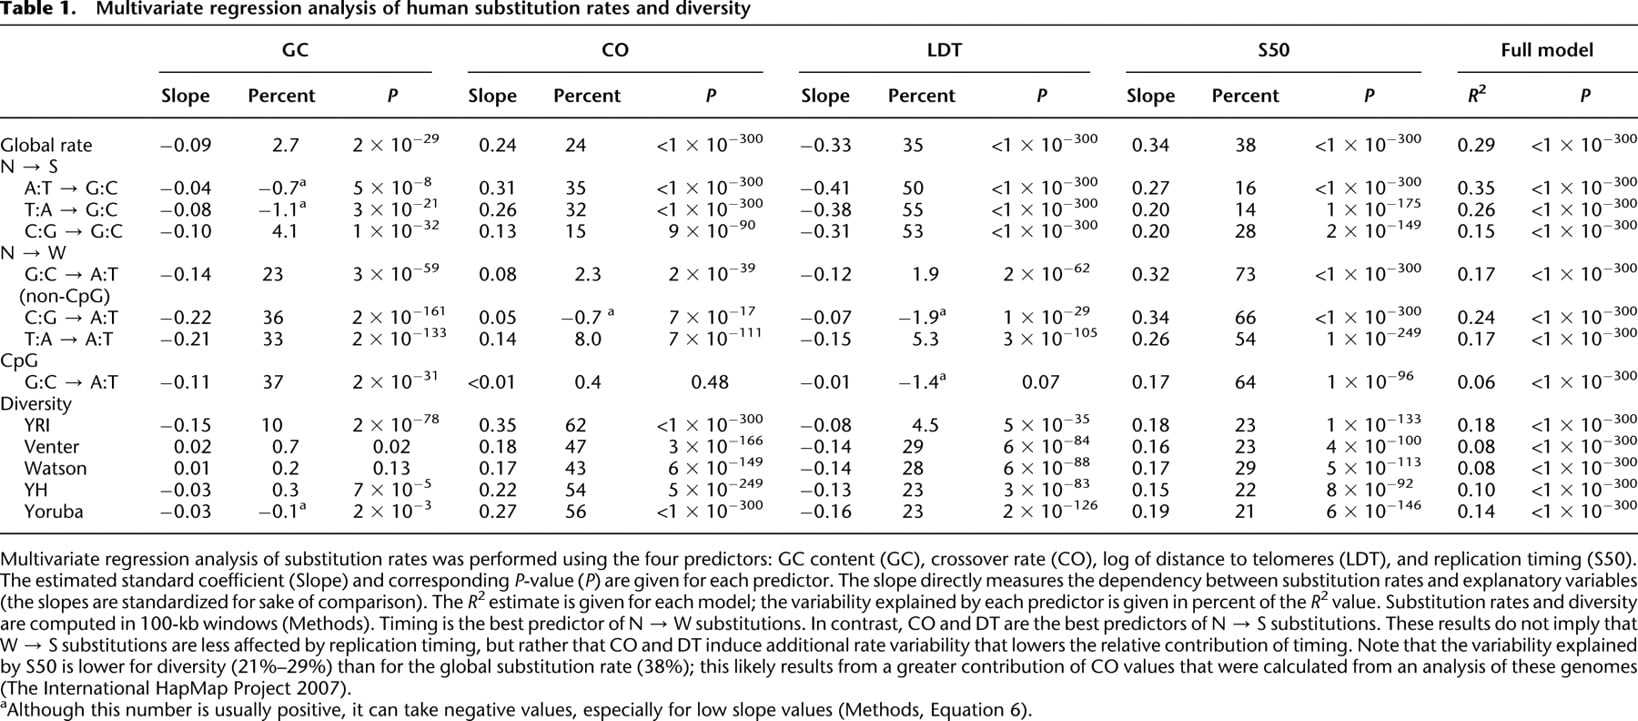
[i] Multivariate regression analysis of substitution rates was performed using the four predictors: GC content (GC), crossover rate (CO), log of distance to telomeres (LDT), and replication timing (S50). The estimated standard coefficient (Slope) and corresponding P-value (P) are given for each predictor. The slope directly measures the dependency between substitution rates and explanatory variables (the slopes are standardized for sake of comparison). The R2 estimate is given for each model; the variability explained by each predictor is given in percent of the R2 value. Substitution rates and diversity are computed in 100-kb windows (Methods). Timing is the best predictor of N → W substitutions. In contrast, CO and DT are the best predictors of N → S substitutions. These results do not imply that W → S substitutions are less affected by replication timing, but rather that CO and DT induce additional rate variability that lowers the relative contribution of timing. Note that the variability explained by S50 is lower for diversity (21%–29%) than for the global substitution rate (38%); this likely results from a greater contribution of CO values that were calculated from an analysis of these genomes (The International HapMap Project 2007).
[ii] aAlthough this number is usually positive, it can take negative values, especially for low slope values (Methods, Equation 6).