Table 1.
The number of genes used in our statistical analysis, the mean variability in dN/dS (ν = |ω1 – ω2|) among old and young genes, the proportional elevation of variability among young genes, and the corresponding Wilcoxon P-value
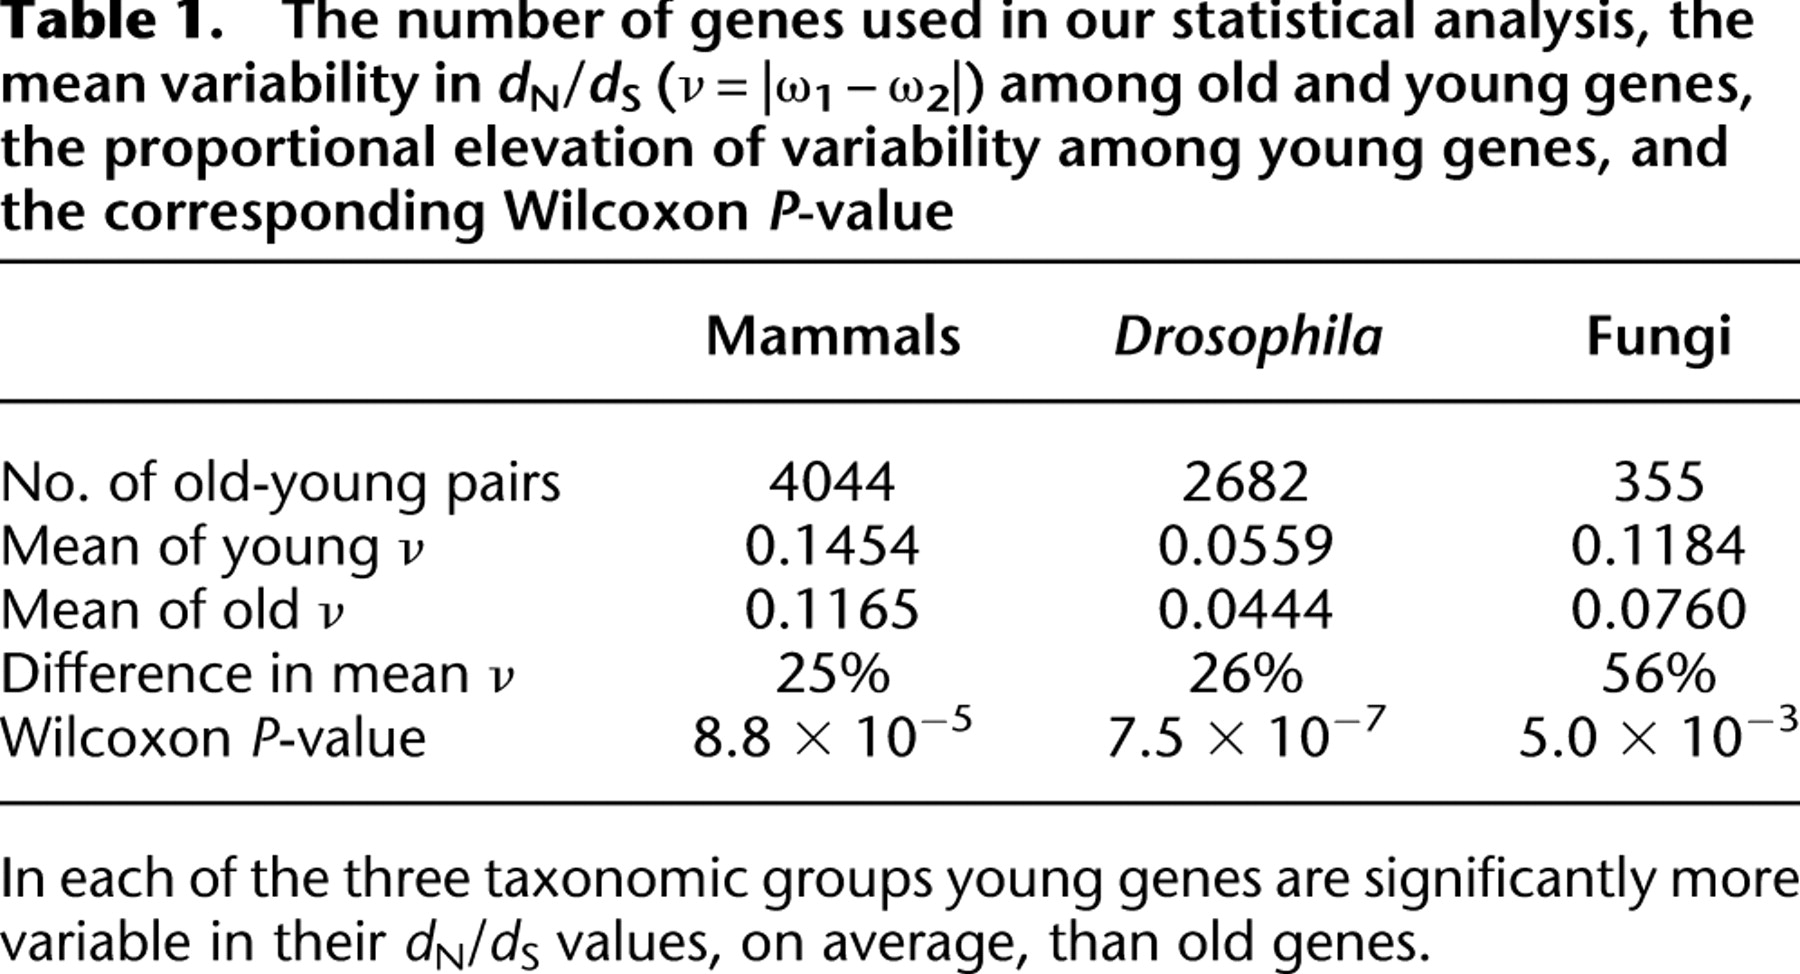
[i] In each of the three taxonomic groups young genes are significantly more variable in their dN/dS values, on average, than old genes.