Table 1.
Correlations of genetic features with GR rates and gene densities
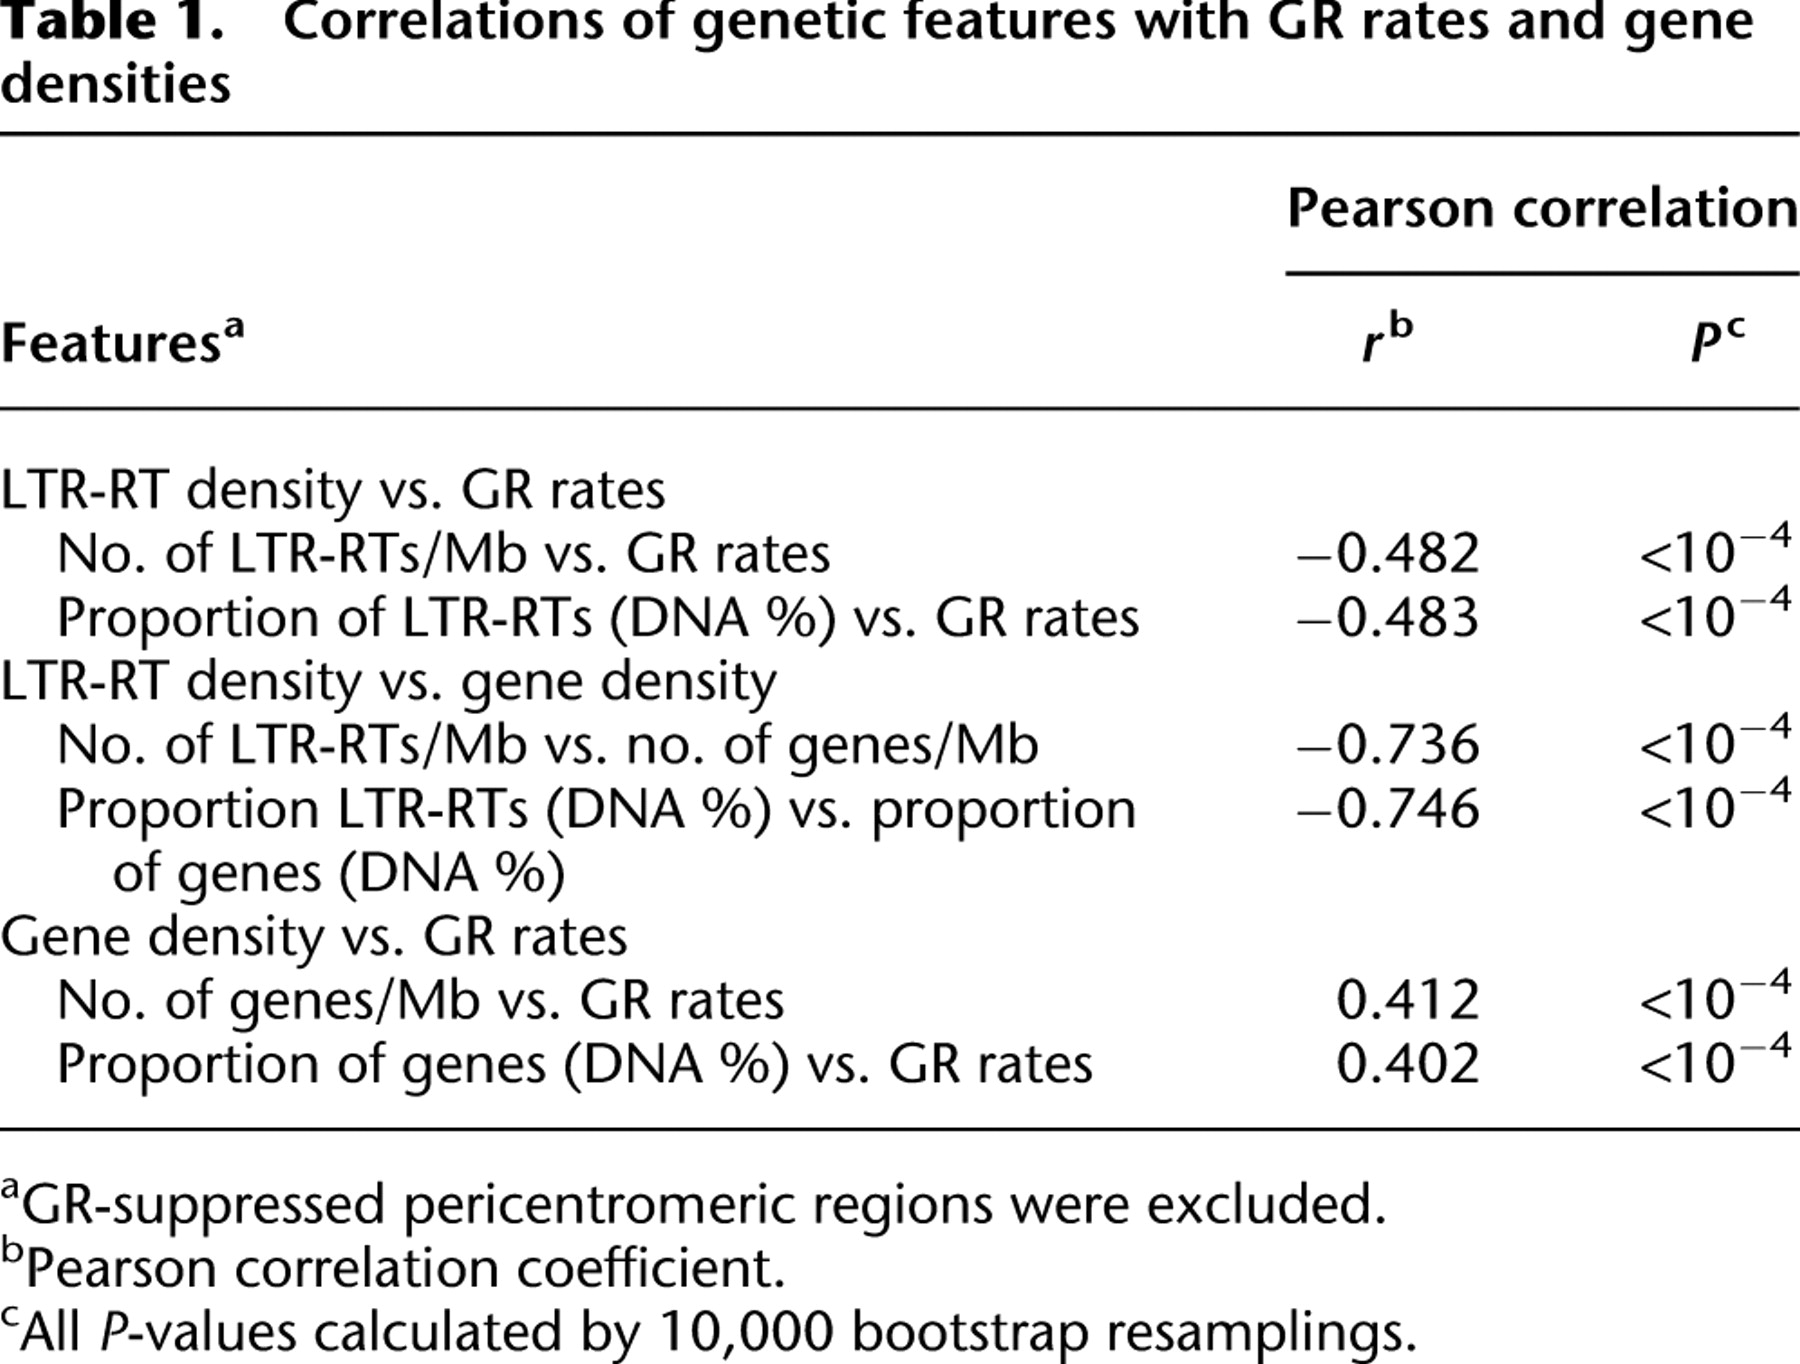
[i] aGR-suppressed pericentromeric regions were excluded.
[ii] bPearson correlation coefficient.
[iii] cAll P-values calculated by 10,000 bootstrap resamplings.
Correlations of genetic features with GR rates and gene densities
[i] aGR-suppressed pericentromeric regions were excluded.
[ii] bPearson correlation coefficient.
[iii] cAll P-values calculated by 10,000 bootstrap resamplings.