Table 1.
Overall number of bound regions and overlaps between data sets
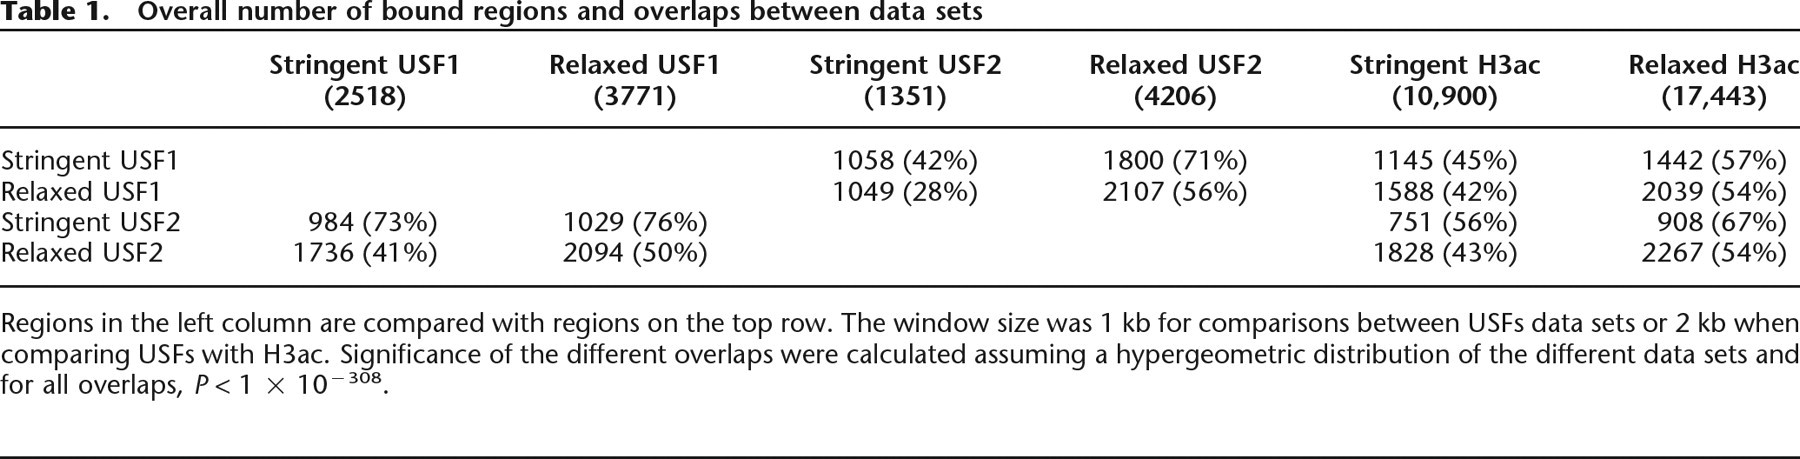
Regions in the left column are compared with regions on the top row. The window size was 1 kb for comparisons between USFs data sets or 2 kb when comparing USFs with H3ac. Significance of the different overlaps were calculated assuming a hypergeometric distribution of the different data sets and for all overlaps, P < 1 × 10−308.