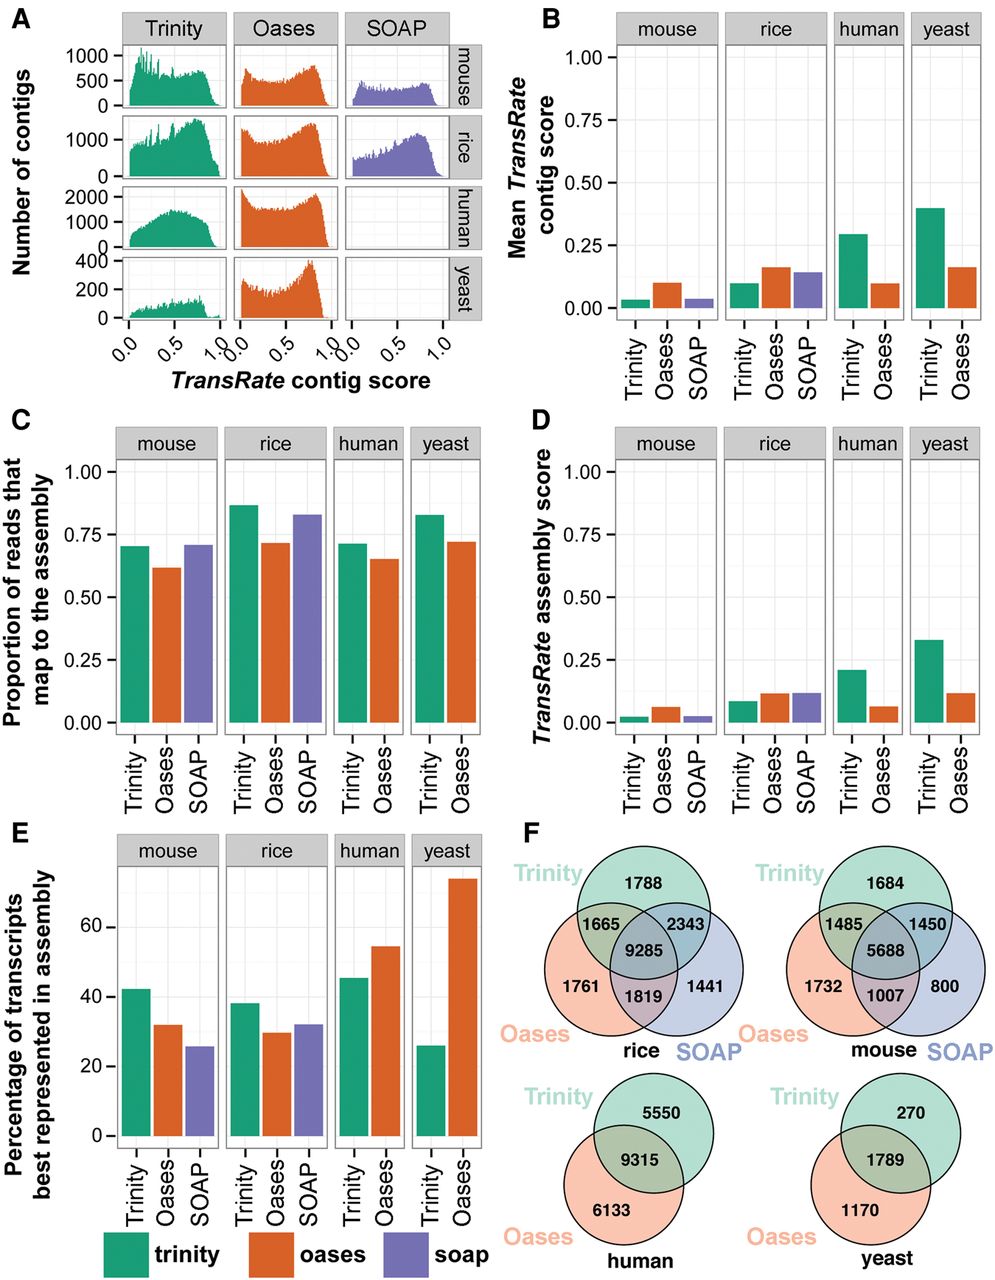
Figure 5.
Calculation of TransRate assembly scores. (A) Distribution of TransRate contig scores for the 10 representative assemblies from real data. (B) Geometric mean of TransRate contig scores for all assemblies. (C) Proportion of reads that map to each assembly. (D) Final TransRate assembly scores for the 10 representative assemblies. (E) The proportion of reference transcripts that are best assembled by individual assembly methods. (F) The number of reference transcripts (identified by reciprocal best BLAST) that are assembled by each assembler.