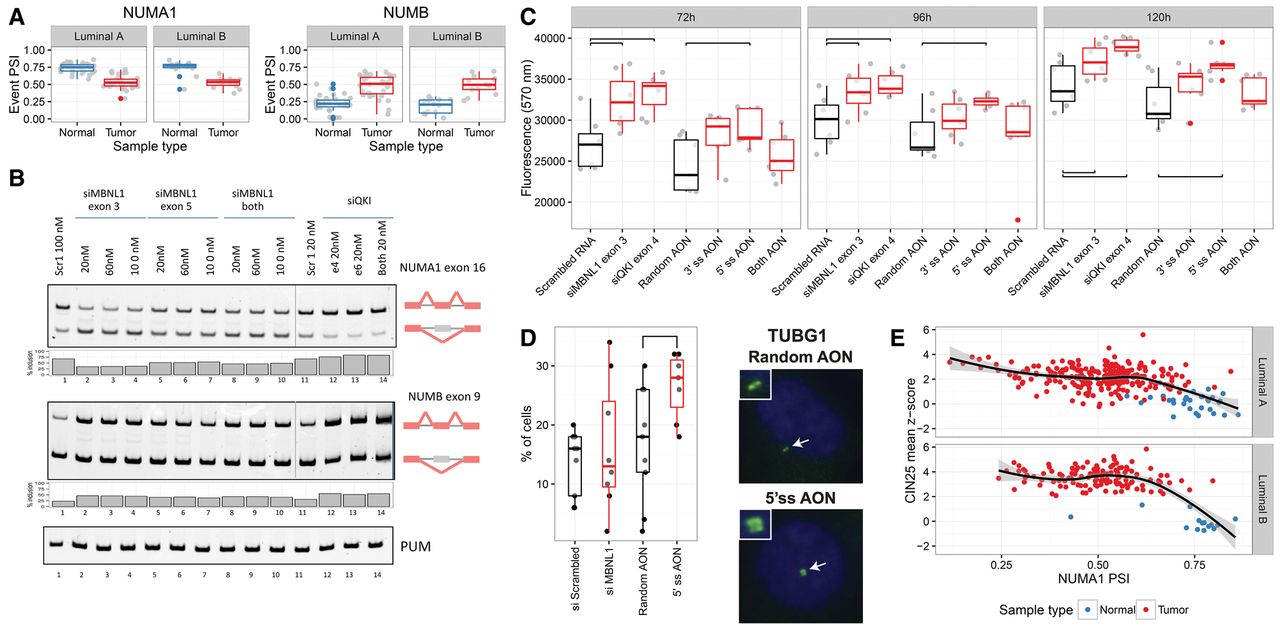
Regulation of NUMA1 alternative splicing by MBNL1 in breast luminal tumors. (A) PSI value distributions in tumor and paired normal sample for luminal A (LA) and luminal B (LB) breast tumors for the events in NUMA1 (LA: ΔPSI = −0.22, P-value = 7.81 × 10⁻⁷, LB: ΔPSI = −0.23, P-value = 0.037) and NUMB (LA: ΔPSI = 0.28, P-value = 0.0001, LB: ΔPSI = 0.28, P-value = 0.016). All P-values given are corrected for multiple testing. (B) Semiquantitative RT-PCR isoform analysis upon knockdowns of MBNL1 (lanes 2–10) and QKI (lanes 12–14) at different siRNA concentrations and the controls with scrambled siRNAs (lanes 1,11). The diagrams to the right indicate the position of the alternatively spliced exons. The bottom lanes correspond to the RT-PCR amplification of RNA from the PUM gene in the same samples, which are used as a control for RNA expression. (C) Resazurin-based assays of cell viability/proliferation. Measurements were performed in triplicate at 72, 96, and 120 h. The plot shows measurements upon knockdowns of MBNL1 (siMBNL1) and QKI (siQKI), upon transfection of AONs targeting the 3′ and 5′ splice-sites independently and both together, and the corresponding controls (scrambled siRNA and random AON). (D, left panel) Graph showing the results of the evaluation of centrosome amplification upon knockdown of MBNL1 (siMBNL1) or upon transfection of AONs targeting 5′ splice-sites (5′ ss AON), compared to the corresponding controls siScrambled (P = 0.4271) and random AON (P = 0.04356), respectively (one-sided Mann-Whitney U test). (Right panels) Representative merged (TUBG1 and DAPI) images of immunofluorescence assays. (E) Correlation of NUMA1 event PSI (x-axis) with the CIN25 signature of aneuploidy (y-axis) across the tumor (red) and normal (blue) samples for luminal A (upper panel) (R = −0.4 Spearman) and B (lower panel) (R = −0.33 Spearman).