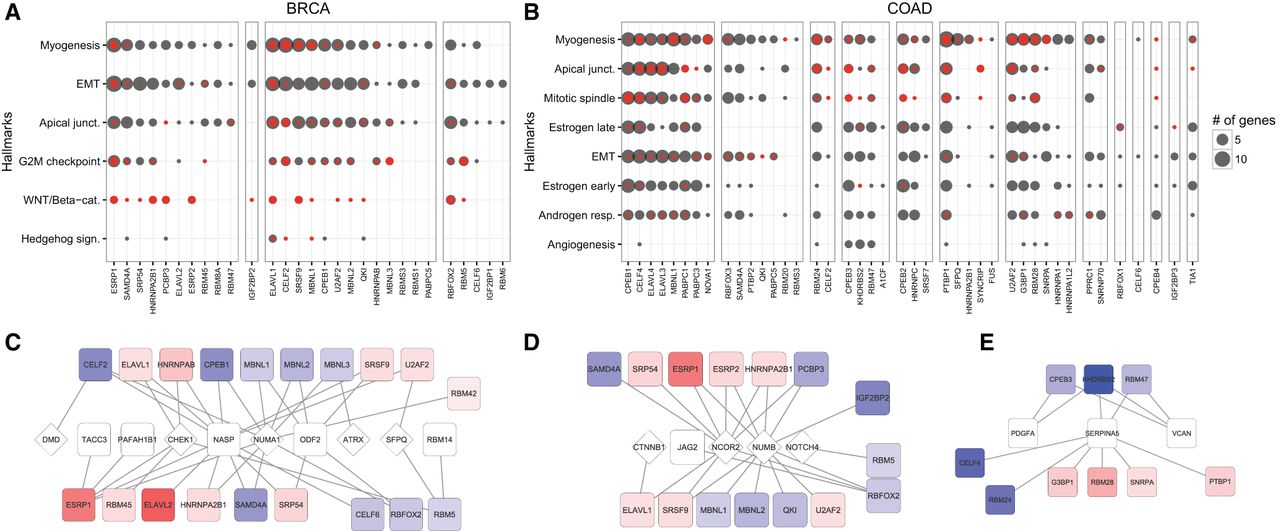
Networks of splicing regulation. Modules of alternative splicing regulation according to cancer hallmarks in breast (A) and colon (B) tumors. For each cluster of RBPs (x-axis), we indicate in gray the total number of gene targets linked to them in each hallmark (y-axis). Only enriched hallmarks are shown. We indicate in red the number of cancer drivers associated with each RBP, and in each cluster RBPs are ordered according to the total number of genes they are associated with. Representation of the regulatory modules for G2M checkpoint (C) and WNT/beta-catenin (D) hallmarks in breast tumors, and for the angiogenesis hallmark (E) in colon tumors. RBPs are indicated as square boxes in red or blue depending on whether they are up- or down-regulated. Target genes are presented as white diamonds for cancer drivers and white boxes for the rest. Connections indicate predicted splicing regulation by an RBP.