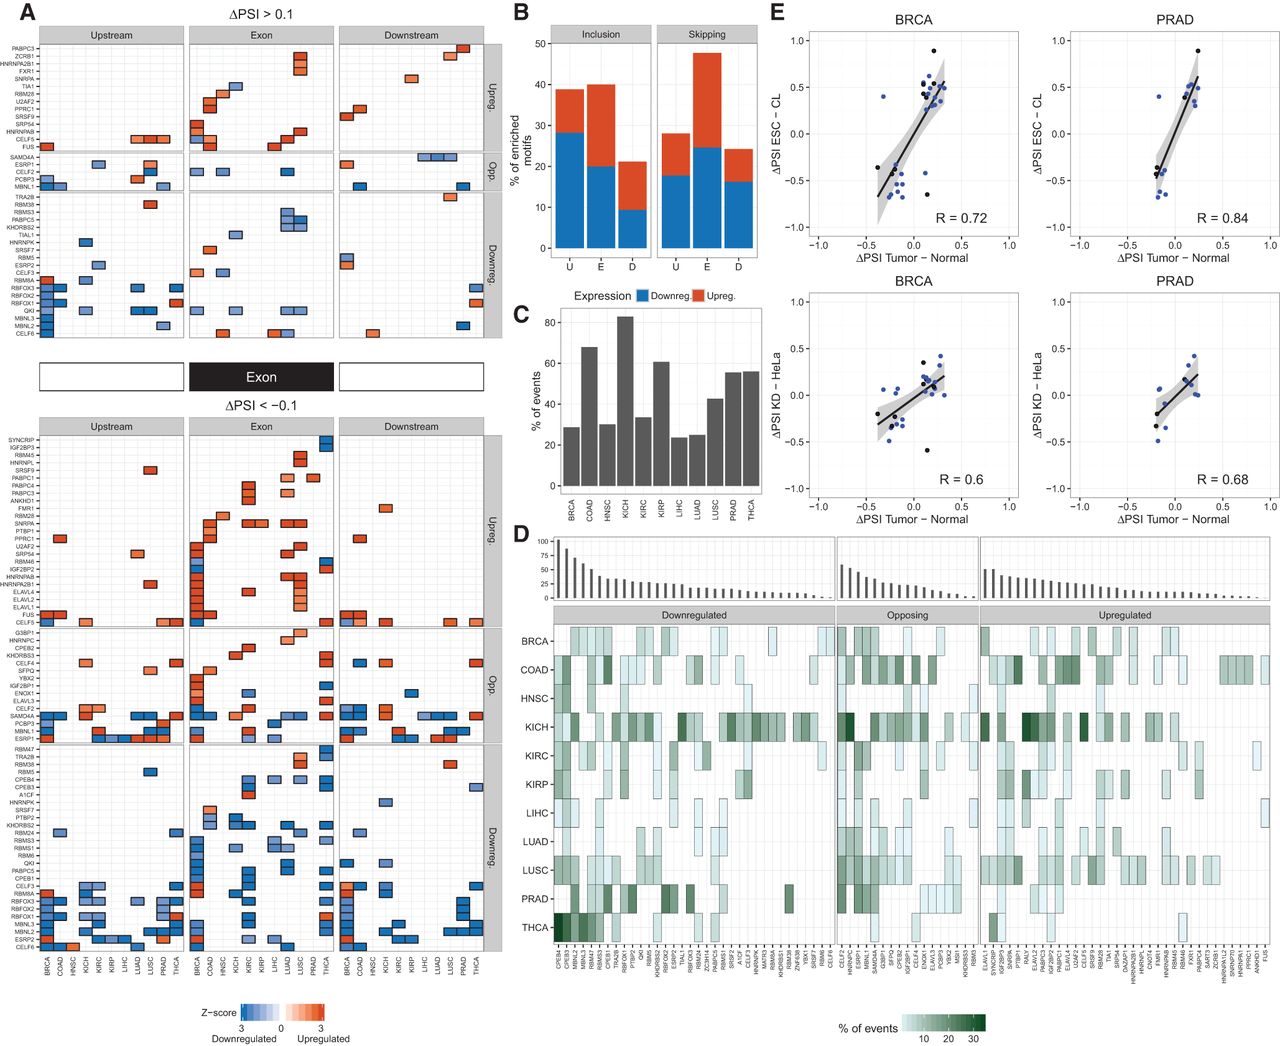
Enriched RNA binding motifs in differentially spliced events. (A) Enriched RNA binding motifs in differentially spliced skipping exon events in each tumor type, separated by inclusion (upper panels) or skipping (lower panels) events, and by upstream (left), exonic (middle), or downstream (right) regions. Only enriched motifs for splicing factors that are differentially expressed are indicated in each tumor type. RBPs (y-axis) are grouped according to Figure 1A. Gene up- and down-regulation is indicated in red and blue, respectively. The color intensity indicates the Z-score of the motif enrichment. Similar plots for the other event types are given in Supplemental Figures S14–S18. (B) Proportion of enriched motifs in inclusion (ΔPSI > 0.1) (left panel) and skipping (ΔPSI < 0.1) (right panel) events, in each of the event regions (x-axis): upstream (U), exon (E), and downstream (D). Proportions are separated according to whether the RBP gene is up- (red) or down- (blue) regulated. (C) Total proportion (y-axis) of differentially spliced events in each tumor type (x-axis) that are predicted as targets of one or more differentially expressed RBPs with significance Z-score > 1.96. (D) Proportion of differentially spliced events (marked in green) that are predicted as targets of each RBP (x-axis) in each tumor type (y-axis), with significance Z-score > 1.96. RBPs are grouped according to Figure 1A. Upper panels indicate the number of unique cancer drivers with differentially spliced events predicted as targets of each RBP across all tumors. RBPs are ordered according to this value within each group. (E) Correlation (Pearson R) of ΔPSI values (x-axes) in breast tumors (BRCA) and prostate tumors (PRAD) with the ΔPSI of events (y-axes) from the knockdown of MBNL1 and MBNL2 in HeLa cells (lower panels) and from the comparison of stem cells (ESCs) with differentiated cells (CL) (upper panels). Events with a predicted MBNL binding motif are indicated in blue.