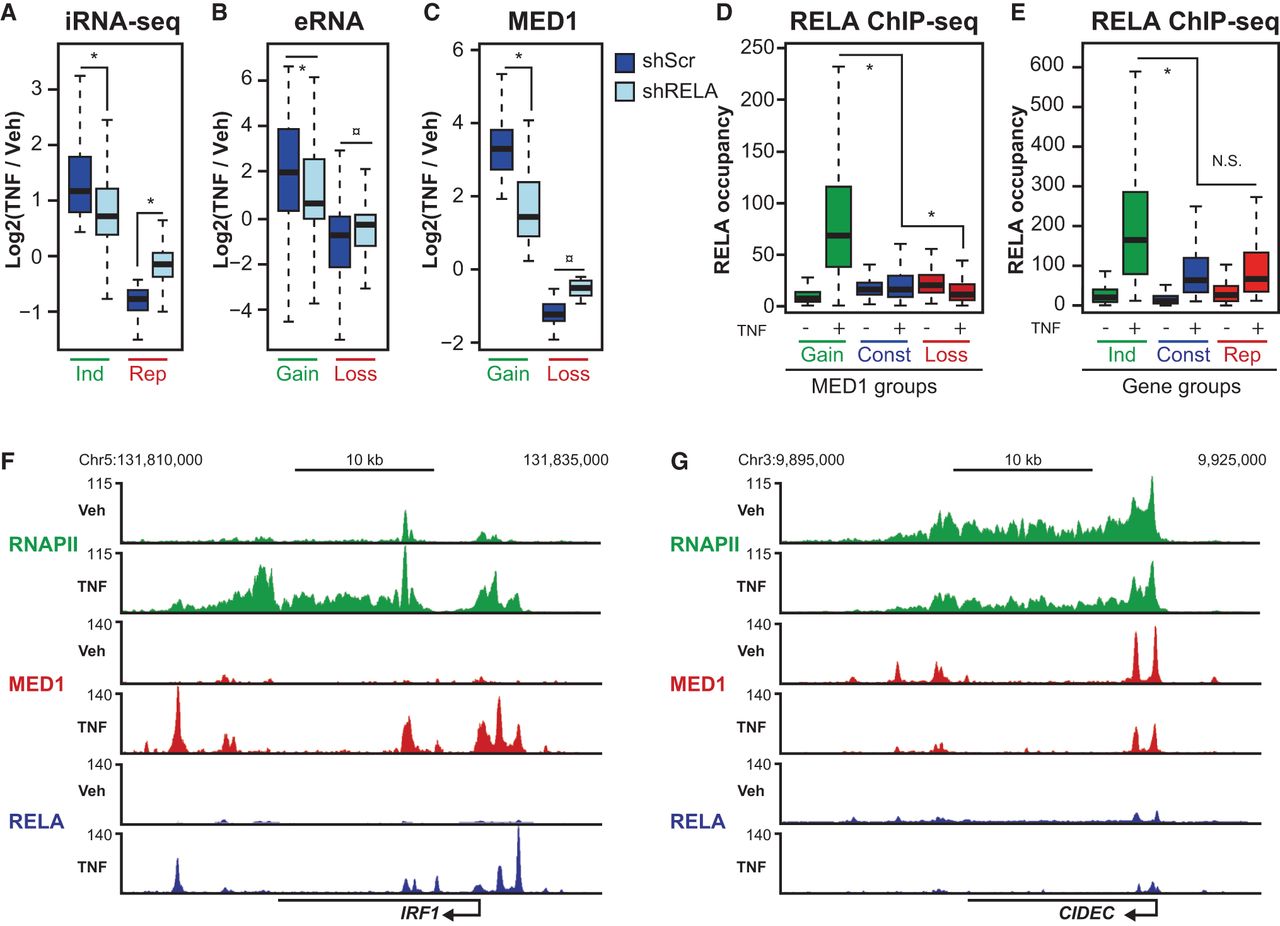
RELA mediates reprogramming of the adipocyte transcriptome through cofactor redistribution. (A–C) At day 6 of differentiation, SGBS adipocytes were transduced with lentiviruses expressing shRNA targeting RELA (shRELA, light blue) or scrambled control shRNA (shScr, dark blue). At day 10, the cells were treated with vehicle or TNF for 90 min before harvest of RNA for total RNA-seq and 60 min before harvest of chromatin for ChIP-qPCR. (A) Box plot representing log2 fold change (TNF/Veh) in nascent RNA for TNF-regulated genes (shScrV vs. shScrT, FDR < 0.01) in shScr- and shRELA-treated cells. P-value: * < 2.2 × 10⁻¹⁶, Wilcoxon rank-sum test. (B) Box plots representing log2 fold change in eRNA at intergenic TNF-regulated MED1 sites defined in Figure 1D in shScr and shRELA-treated SGBS adipocytes. P-value: * < 2.2 × 10⁻¹⁶, ¤ = 2.58 × 10−06, Wilcoxon rank-sum test. (C) Box plots representing log2 fold change in MED1 occupancy at a subset of TNF-regulated MED1 sites in shScr- and shRELA-treated SGBS adipocytes, n = 7–8. Data are representative of three independent experiments. P-value: * = 9.66 × 10−05, ¤ = 1.06 × 10−06, Student's t-test. (D) Box plots representing RELA occupancy at TNF-regulated and constant MED1 sites defined in Figure 1D. Differentiation and treatment of cells for RELA ChIP-seq was performed as described in Figure 1. P-value: * < 2.2 × 10⁻¹⁶, Wilcoxon rank-sum test. (E) Box plots representing summarized RELA occupancies at all RELA binding sites within 20 kb of the TSS of TNF-regulated genes defined in Figure 1A. P-value: * < 2.2 × 10⁻¹⁶, Wilcoxon rank-sum test. (F,G) UCSC Genome Browser screenshots of RNAPII (green), MED1 (red), and RELA (blue) occupancy at gene loci of a typical induced gene, IRF1 (F), and a typical repressed gene, CIDEC (G).