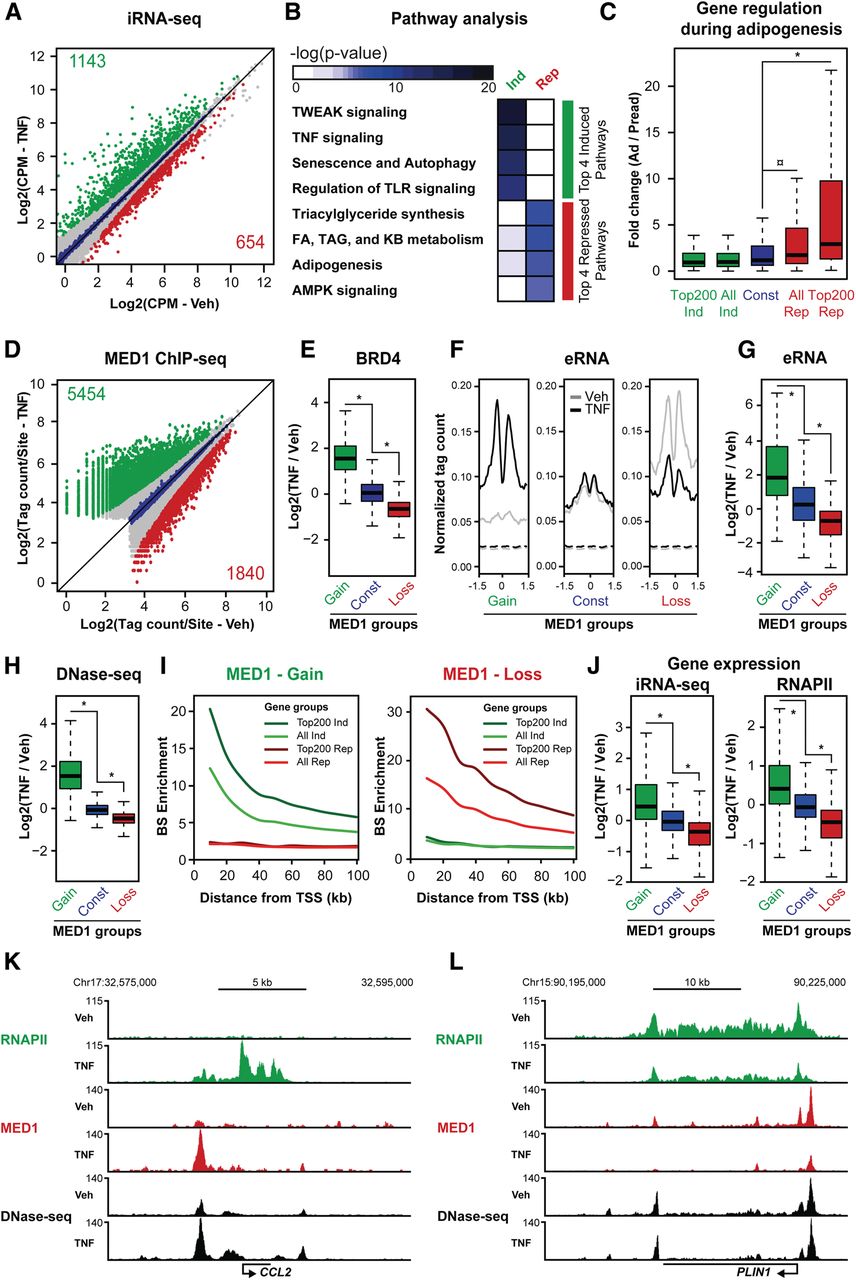
Acute reprogramming of adipocyte genes and enhancers by TNF. Following 10 d of differentiation, human SGBS adipocytes were treated with vehicle or TNF for 90 or 60 min before harvest of RNA for total RNA-seq and chromatin for ChIP-seq. In addition, total RNA-seq was performed in SGBS cells harvested at day 0 of differentiation. Changes in transcriptional activity and mRNA expression were determined using the iRNA-seq pipeline. (A) Scatter plot illustrating log2 normalized mean tag counts in introns of RefSeq gene bodies in control vs. TNF-stimulated SGBS adipocytes. Green and red dots represent genes that were determined to be induced and repressed, respectively (FDR < 0.01). Blue dots represent constitutive genes (FDR > 0.9; |log2FC| < 0.2). (B) Heat map representing −log(P-values) for the top four enriched pathways for genes induced and repressed by TNF. (C) Box plots representing fold change in mRNA expression (exon reads) during adipogenesis for TNF-regulated and constitutive gene groups defined in A and Supplemental Figure S1C. P-value: ¤ = 3.73 × 10⁻⁹,* < 1.99 × 10⁻¹⁵, Wilcoxon rank-sum test. (D) Scatter plot illustrating log2 normalized mean MED1 tag counts in MED1 sites in vehicle vs. TNF-stimulated SGBS adipocytes. Green and red dots represent sites with gain and loss of MED1, respectively, following TNF stimulation (FDR < 0.01). Blue dots represent sites with constant MED1 binding (FDR > 0.8; |log2FC| < 0.2). (E) Box plot showing log2 fold change in BRD4 tag counts for TNF-regulated and constant MED1 sites defined in D. P-value: * < 2.2 × 10⁻¹⁶, Wilcoxon rank-sum test. (F) Aggregate plots showing enhancer transcript levels in a 3-kb window around the center of intergenic TNF-regulated and constant MED1 sites defined in D. (G) Box plot representing log2 fold change in enhancer transcript levels at intergenic TNF-regulated and constitutive MED1 sites defined in D. Tags were counted in a region of 2 kb around the MED1 peak center. P-value: * < 2.2 × 10⁻¹⁶, Wilcoxon rank-sum test. (H) Box plot showing log2 fold change in DNase-seq tag counts for TNF-regulated and constant MED1 sites defined in D. P-value: * < 2.2 × 10⁻¹⁶, Wilcoxon rank-sum test. (I) Enrichment of TNF-regulated MED1 sites defined in D near TNF-regulated genes defined in A. Enrichment was determined as the number of binding sites per gene within different distances from the TSS (10–100 kb) of regulated genes relative to the number of binding sites per gene of constitutive genes. (J) Box plots representing log2 fold change (TNF/Veh) in iRNA-seq (left) and RNAPII (right) read counts for genes with TSS within 20 kb of TNF-regulated and constant MED1 sites defined in A. P-value: * < 2.2 × 10⁻¹⁶, Wilcoxon rank-sum test. (K,L) UCSC Genome Browser screenshots of RNAPII (green) and MED1 (red) occupancy and DNase-seq (black) tags at gene loci of a typical induced (CCL2) (K) and repressed (PLIN1) (L) gene.