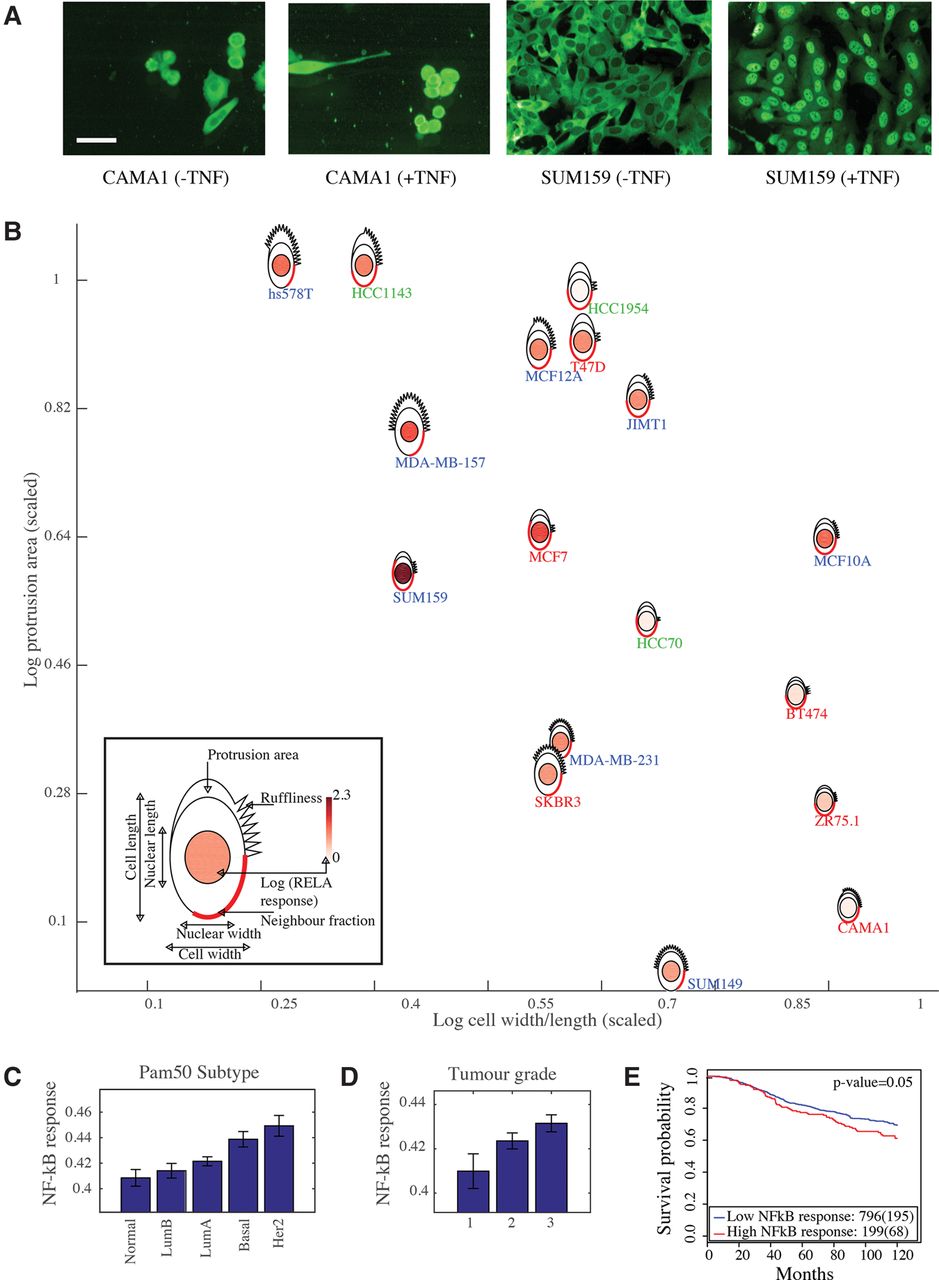
Derivation of NF-κB response metagene and its association with the clinical parameters in the METABRIC data set. (A) CAMA1 and SUM159 cells stained with anti-RELA/NF-κB antibody (−/+TNF). Scale bar = 50 µm. (B) Representation of seven morphological BCL features and RELA response (fold change +TNF/−TNF) using PhenoPlot (Sailem et al. 2015), where BCL glyphs are positioned based on the value of cell W/L (x-axis) and protrusion area (y-axis). Cell line label color indicates molecular subtype. Red: luminal, green: basal A, and blue: basal B. (C) Association between Pam50 subtype and NF-κB response metagene (Jonckheere–Terpstra test P-value < 0.0005). Error bars indicate the SEM. (D) Association between tumor grade and NF-κB response metagene (Jonckheere–Terpstra test P-value < 0.0005). Error bars indicate the SEM. (E) Kaplan–Meier curves to illustrate the disease-specific survival probabilities of patient groups in the discovery cohort in the METABRIC data set, stratified by NF-κB response metagene.