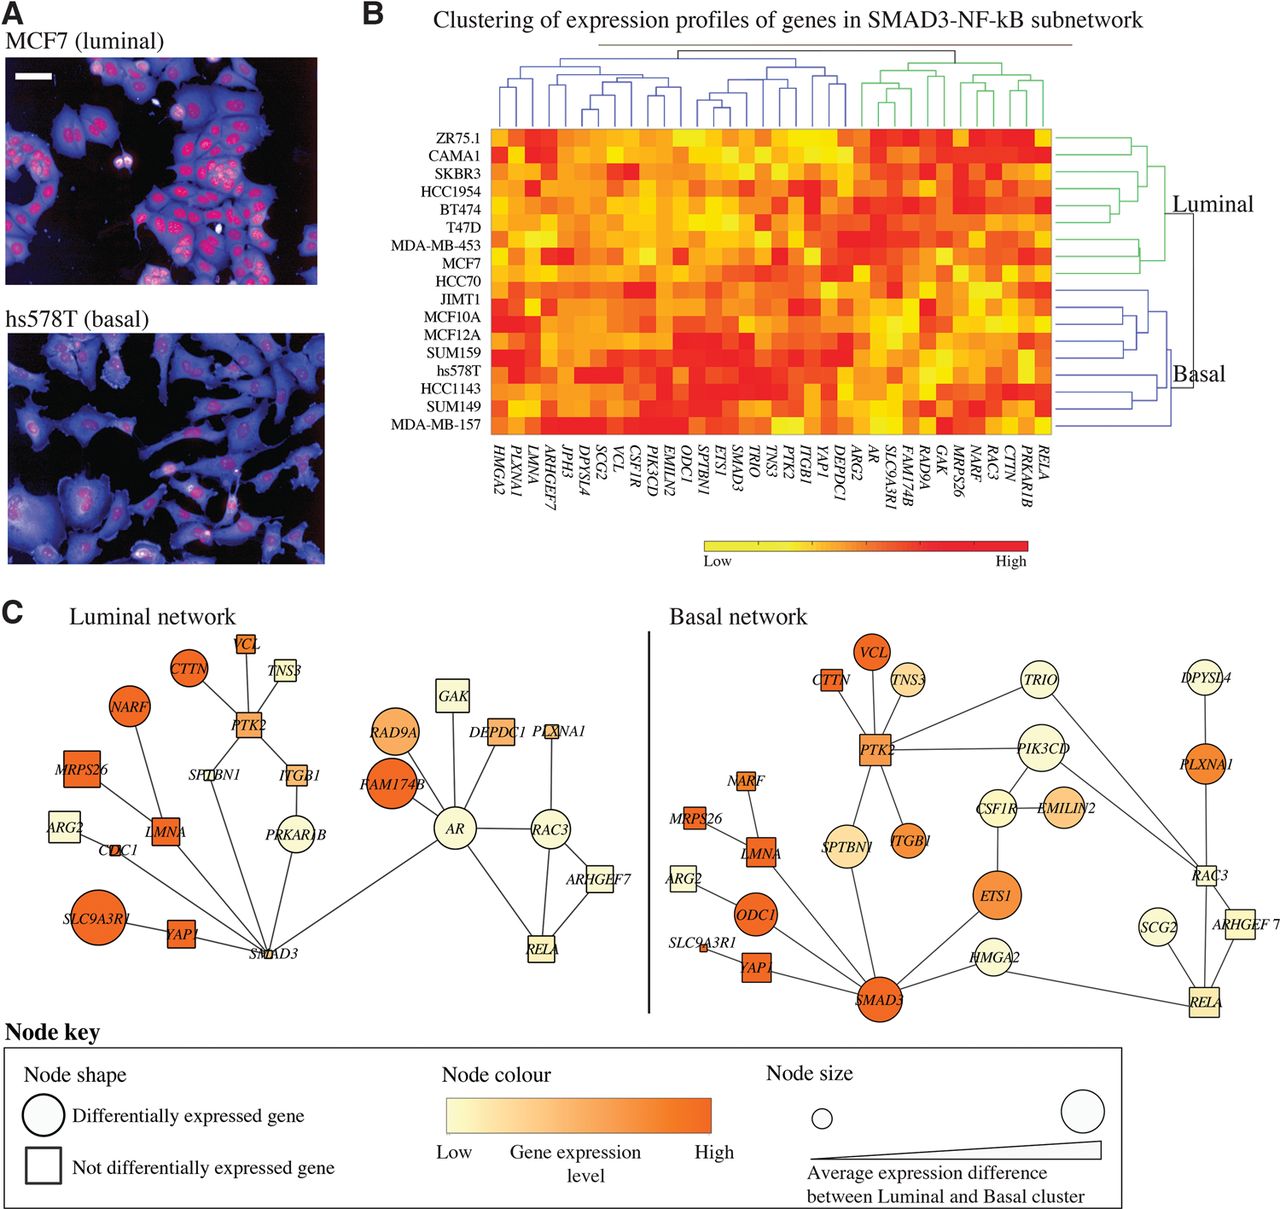
The expression profiles of shape-correlated genes that drive transcriptional activities of SMAD3 and RELA in luminal versus basal breast cell types. (A) Representative examples of luminal vs. basal shapes. Red: DAPI, blue: DHE. Scale bar = 50 µm. (B) Clustering of 18 BCLs based on the expression of shape-correlated genes in Figure 4 separates cell lines into luminal (green) and basal (blue) subtypes. The basal cluster includes only basal cell lines. The luminal cluster includes mostly luminal cell lines and the basal A cell lines HCC70 and HCC1954. (C) Networks of the expressed genes in the luminal/basal clusters in B, where differentially expressed genes between luminal and basal clusters are represented as circles. Genes that have a higher average expression difference between luminal and basal cluster have a larger node size. Node color indicates the average expression values in each cluster.