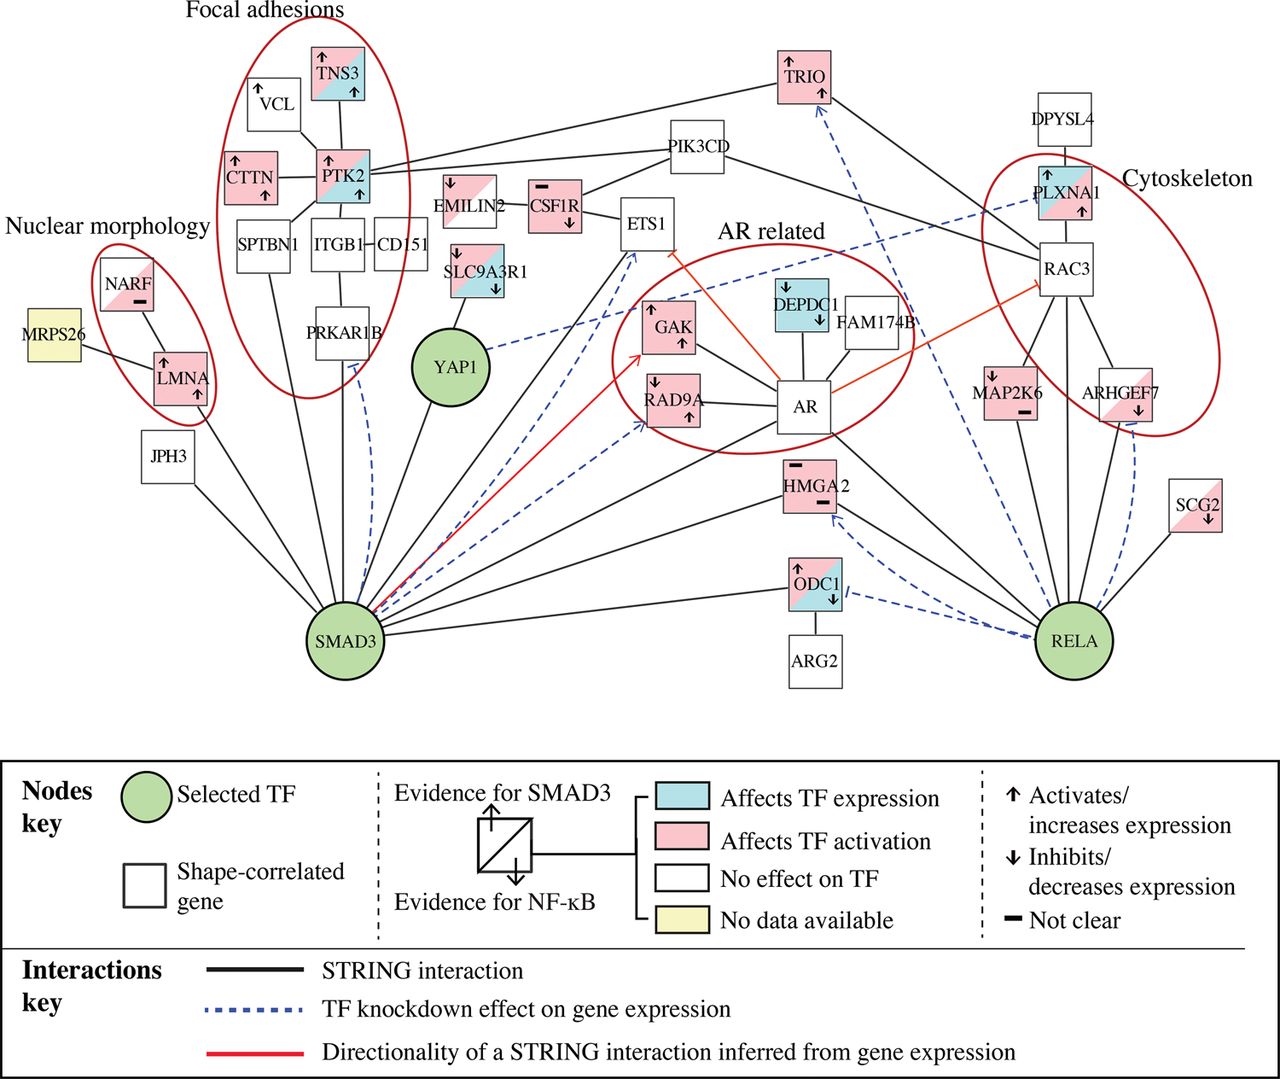
Figure 4.
SMAD3-NF-κB subnetwork. Proteins that are in a direct path from a phenotypic feature to RELA, SMAD3, or YAP1 (Supplemental Table S6) and their interactions based on STRING. Edges in dashed lines are based on gene expression and indicate feedback from a TF to proteins encoded by shape-correlated genes.