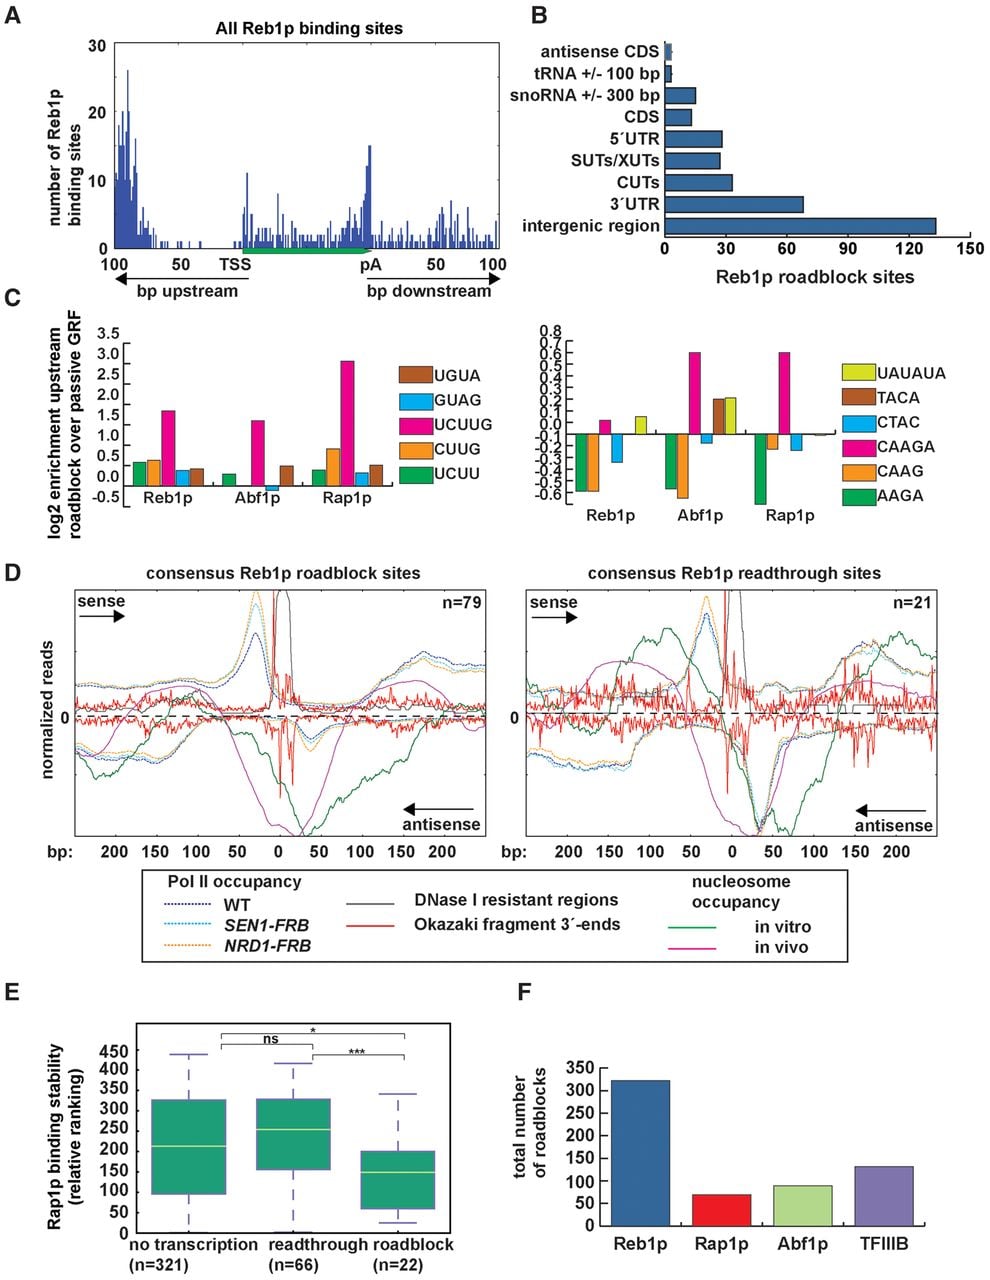
NNS termination signals globally specify the fate of Pol II collisions with general regulatory factors (GRFs). (A) Distribution of all Reb1p binding sites within ORF-Ts (binned into 100 regions) and their flanking 100-bp regions. (B) Genomic distribution of xPAT clusters with peaks proximally upstream of experimentally validated Reb1p binding sites (see Methods). (C, left) Motif enrichment upstream of binding sites for the GRFs Reb1p, Abf1p, and Rap1p. One hundred-nucleotide sequences upstream of roadblock sites and readthrough GRF sites were analyzed for Nrd1p (UGUA and GUAG) and Nab3p (CUUG, UCUU, and UCUUG) motifs. The y-axis plots the log2 motif enrichment upstream roadblock versus readthrough sites. (Right) Enrichment of the reverse complements of Nrd1p and Nab3p motifs and the UAUAUA Hrp1p/Nab4p motif as controls. (D) Pol II PAR-CLIP and Pol δ Okazaki fragment 3′-ends around Reb1p sites with the consensus motif (TTACCCGG). The signal above the zero line represents the sense strand with respect to the direction of Pol II roadblock (left) or readthrough (right) for each Reb1p site, while the signal from the opposite strand is plotted below the zero line. (E) Rap1p binding sites were grouped according to readthrough behavior, roadblocking behavior, or no convergent Pol II transcription (see Methods). The stability rankings for each Rap1p binding site were obtained from a previous study (Lickwar et al. 2012). Box plots show median stability ranking (green horizontal line) and lower and upper quartile for the three classes of Rap1p binding sites. (***) P < 0.001, (*) P < 0.05, (ns) not significant. (F) Global distribution of Pol II roadblocks for each DNA-binding factor. Roadblocks are called according to the presence of xPATs within a window 5–25 bp upstream of the binding site (≥1 rpm, greater than or equal to twofold up-regulation over WT).