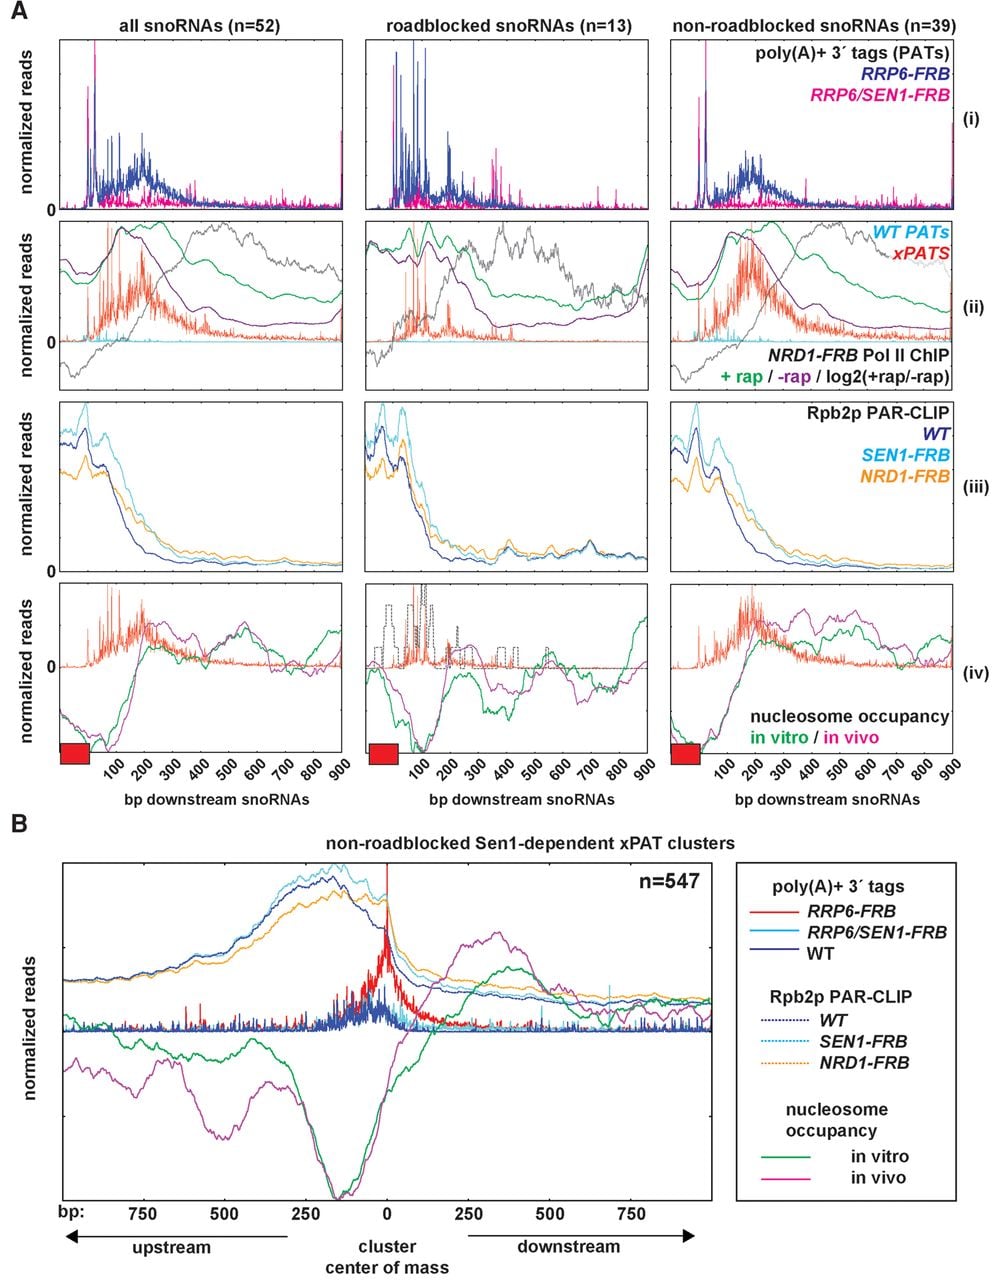
Two distinct classes of NNS-dependent snoRNA transcription termination. (A) Pile-up analysis of a 900-bp region downstream from snoRNA genes for all NNS-terminated snoRNAs (left), snoRNAs with RRP6/DIS3-FRB PAT (xPAT) cluster peaks associated with downstream DRS (roadblocked snoRNAs; middle), and snoRNA xPAT cluster peaks without downstream DRS (nonroadblocked snoRNAs; right). (i,ii,iv) PATs for the indicated strains. (ii) Pol II ChIP signal from NRD1-FRB strains in the absence (purple) or presence (green) of rapamycin, with the gray line indicating the log2 ratio of rapamycin treated over untreated cells. (iii) Pol II occupancy as assayed by PAR-CLIP of Rpb2p for the indicated strains. (iv) The distribution of xPATs relative to nucleosome occupancy. (iv, middle) DRS signal (dashed gray line) included. The y-axes for all plots represent normalized reads. (B) Pile-up analysis on the centers of mass of clusters greater than or equal to twofold up-regulated in RRP6-FRB relative to RRP6/SEN1-FRB and lacking downstream DRS for the indicated data sets. Pol II PAR-CLIP and nucleosome occupancy are depicted as in A. The number of clusters included in pile-up analyses is indicated in the upper right (n = 547).