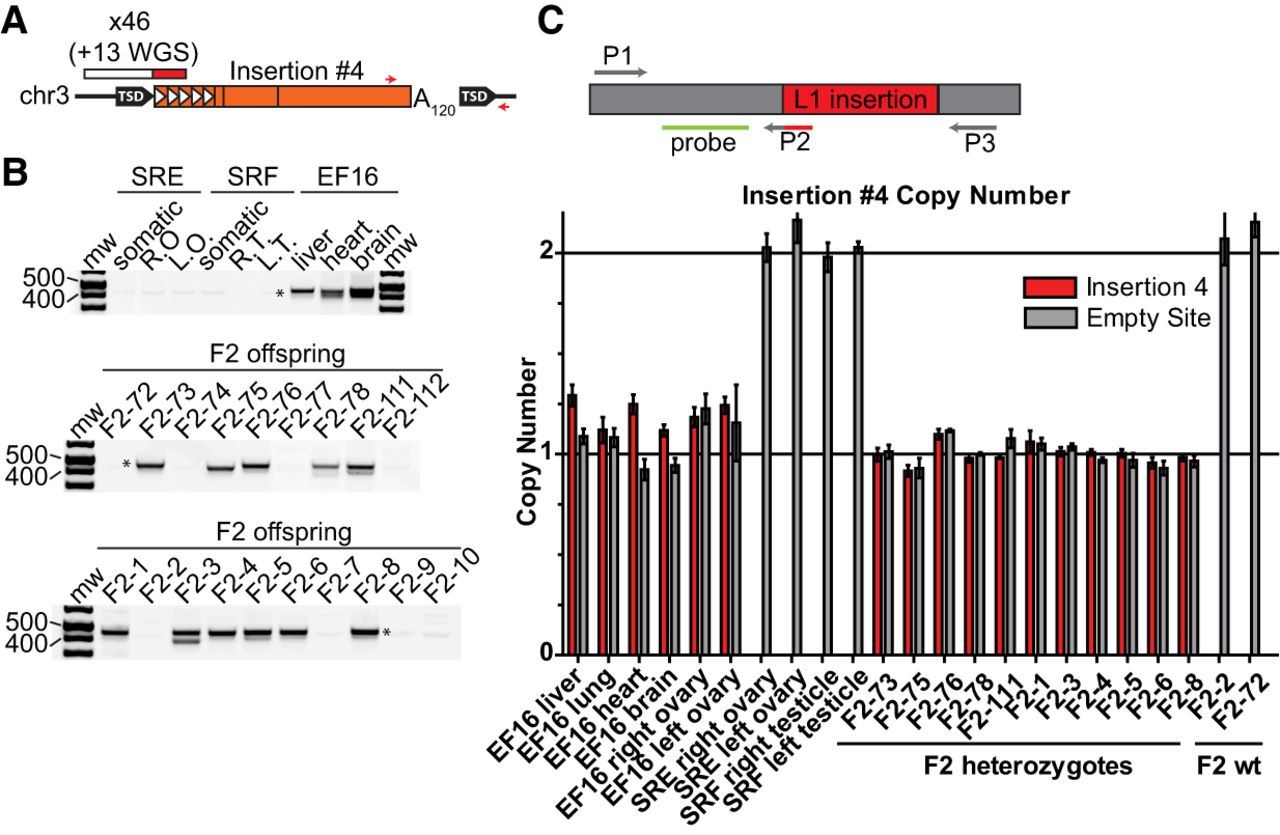
Retrotransposition in the late germline. (A) Diagram of insertion #4. Features are depicted as in Figure 2A. Red arrows indicate the position of 3′ junction genotyping primers. (B) Genotyping panel for insertion #4. SRE and SRF are P-generation mice, SREF16 is the F1 maternal mouse, and 72-78, 111-112, and 1-10 are the F1 offspring of SREF16 and SRCD14. (Somatic) Mix of liver, heart, and brain genomic DNA; (R.O., L.O.) right ovary, left ovary; (R.T., L.T.) right testicle, left testicle. Variation in size of the 3′ junction genotyping band likely reflects shortening of the poly(A) tract of insertion #4, as previously reported (Grandi et al. 2013). (C) Prevalence of insertion #4 among tissues of maternal mouse SREF16. X-axis, from left: tissues of F1 mouse SREF16, ovaries and testicles of P mice SRE and SRF, liver of 11 F1 mice heterozygous for insertion #4, and liver of two F1 mice lacking insertion #4. The average value among the 11 heterozygous F1 mice is set as a copy number of 1. Data are reported as the mean and standard deviation of three independent qPCR experiments, each comprising four technical replicates per reaction. (Top) Schematic of the probe-based qPCR assay used to quantify insertion #4 and empty site prevalence. The L1 insertion is shown in red; positions of the forward primer (P1) junction-spanning filled site reverse primer (P2), empty site reverse primer (P3), and hydrolysis probe (green) are indicated.