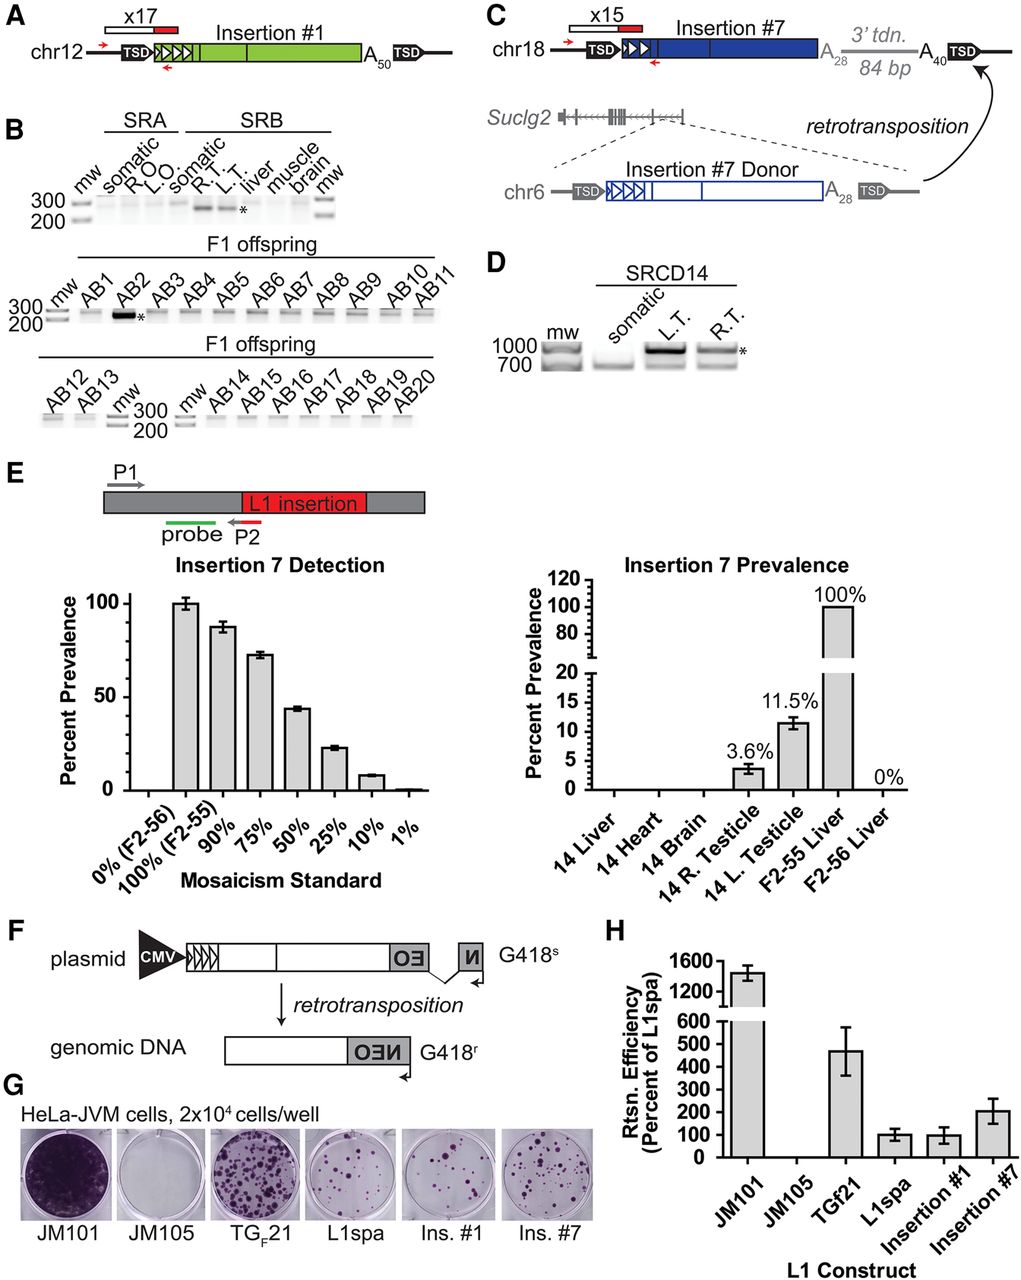
Retrotransposition and the generation of new active L1 copies in primordial germ cells. (A) Schematic of insertion #1. Red/white rectangle indicates mRC-seq reads. Red arrows indicate PCR primers used for genotyping. Triangles within the L1 5′ UTR represent TF monomer units. (An) poly(A) tract, (TSD) target-site duplication. (B) Genotyping panel for insertion #1. SRA (maternal) and SRB (paternal) tissues are indicated. (Somatic) Mix of liver, skeletal muscle, and brain genomic DNA; (R.O., L.O.) right ovary, left ovary; (R.T. and L.T.) right testicle, left testicle. F1 offspring of SRA and SRB (SRAB 1–20) were analyzed. Genotyping PCR was performed on liver gDNA for SRAB 1–9 and on whole embryo gDNA for SRAB 10–20. Here and in all subsequent figures, the validation product is marked with an asterisk. (C) Schematic of insertion #7 and its donor element on Chr 6. Features are annotated as in A; an 84-bp 3′ transduction of gDNA downstream of the Chr 6 donor element is represented in gray. The position of the donor element within the first intron of the gene Suclg2 on Chr 6 is shown. (D) 5′ junction PCR validation for insertion #7. (E) A quantitative PCR (qPCR) assay for the prevalence of insertion #7. A forward primer (P1, gray) is situated within flanking genomic DNA, and a reverse primer (P2, gray/red) spans the junction between the 5′ end of the L1 and the genomic sequence. A hydrolysis probe (green) is situated within genomic sequence adjacent to the reverse primer and on the same strand. Bottom, left: the qPCR assay can detect mosaicism for insertion #7. The x-axis indicates the mosaicism standard used. The y-axis and percentages above each bar show detected percent prevalence, with the heterozygous animal set to 100%. Data are reported as the mean and standard deviation of four technical replicates per reaction. At right, the qPCR assay applied to somatic tissues (x-axis) and the germ cell fraction from the right and left testicles of SRCD14. Data are reported as the mean and standard deviation of three independent qPCR experiments, each comprising four technical replicates per reaction. (F) Rationale of the cultured cell retrotransposition assay (Moran et al. 1996; Wei et al. 2000). (G) Retrotransposition assay in human HeLa-JVM cells for insertion #1 and insertion #7. JM101 is a retrotransposition-competent human L1 (L1.3); JM105 is a negative control, consisting of L1.3 with a reverse transcriptase active site mutation. TGF21 is an active GF subfamily mouse L1; L1spa is an active TF subfamily mouse L1. Colony formation indicates a successful retrotransposition event. (H) Quantification of the retrotransposition assay. L1spa retrotransposition efficiency is set to 100%. Data are reported as the mean and standard deviation of three independent experiments (biological replicates), each of which comprised three technical replicates.